
Robert Rhea wrote in The Dow Theory nearly 90 years ago that “the usefulness of the Dow Theory improves with age. Certainly a more comprehensive study of the subject is possible with a … (longer-term) record … while those who use it … years from now will have a greater advantage than we now enjoy.” And indeed we do have a great advantage, and here’s how the advancements to the Dow Theory for the 21st Century have evolved…
Many have tried to improve on the Dow Theory’s results and failed, however we have made changes that do improve those results.
We illustrate several improvements within the framework of Charles Dow’s original thoughts and premises that would have increased the performance of the traditional “Dow’s Theory” over the last 60+ years.
Learn moreCapitulation is another word for panic selling, or liquidating a position in a security for a loss as it declines in price for fear of additional loss.
One of the calculations we leverage at The Dow Theory has to do with a short-term oscillator which measures the percent of divergence between the three major stock market indices (DJIA, S&P500, and the NYSE Composite) and their time-weighted moving averages.
When two of the three indices are simultaneously in double digits below those respective moving averages, we have Capitulation.
Some bear markets end, however, with a whimper, hence no Capitulation indication.
Learn more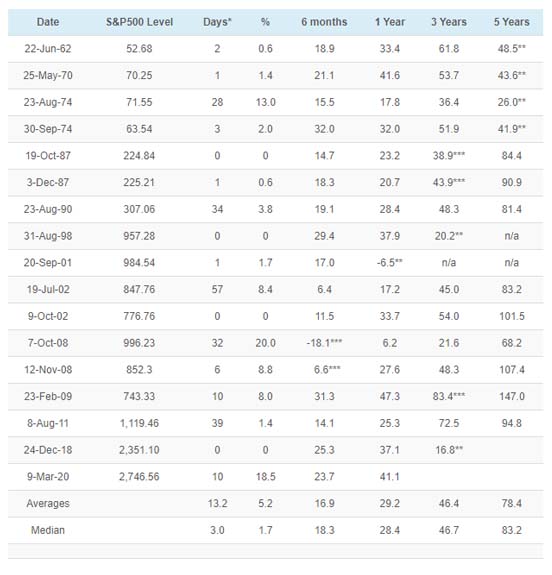

Two environments are constructive to higher stock prices and can be objectively measured, thereby lending themselves to be integrated into a timing indicator. The first one is the trend of margin debt. The second one is the relative strength of “aggressive” sectors (i.e., the S&P500) v. defensive sectors (i.e., Utilities).
There is a high probability of higher prices when either is present.
Our BTI does not use a MA to appraise the trend of MD. It uses similar patterns as those applied by the Dow Theory to pinpoint the relevant highs and lows to be pierced to signal a change of trend. As with the Dow Theory, there is a minimum extent requirement for any movement to be meaningful.
Learn moreI believe that the Dow Theory and my Blay Timing Indicator are the two premier stock market major trend timing indicators with documented and verified long term records which set the standard for market timing.
At the same time, I have been concerned that both are sometimes slow in determining a change in the market’s trend. Obviously, no indicator can pick market tops and bottoms precisely, and none have come closer on a consistent basis than these two, yet, there is always room for improvement. By combining the two plus adding some other tried and true indicators, I believe that real synergism has been attained.
Synergy: “The interaction of two or more agents or forces so that their combined effect is greater than the sum of their individual effects.”
Learn more

TheDowTheory.com has remained true to Charles Dow’s original theory and has continued to interpret it as we think Mr. Dow would have done, keeping it up to date into the 21st Century. The record over the last 115 years has been outstanding. The Dow Jones Industrial and Transportation continue to work in sync with each other as a barometer of business conditions.