(abridged report without updated trades. Full report available only to Subscribers)
Two environments are constructive to higher stock prices and can be objectively measured, thereby lending themselves to be integrated into a timing indicator. The first one is the trend of margin debt. The second one is the relative strength of “aggressive” sectors (i.e., the S&P500) v. defensive sectors (i.e., Utilities). There is a high probability of higher prices when either is present.
The trend of margin debt was documented (“Stock Market Logic”, Fosback 1991) to be an excellent timing indicator. Margin debt has not lost its mojo, and my updated calculations show that, to this day, it continues to be an effective tool for forecasting future stock prices. Margin debt (MD) is the ultimate measure of investor participation. Cash in brokers’ accounts may be bullish (money ready to be invested) or bearish (money hiding from stocks). However, MD can only increase if investors are bullish and willing to leverage their existing holdings to buy more. Conversely, if MD shrinks, it shows that investors are pulling back or, worse, that margin calls are forcing liquidation. My studies show that an expanding MD is associated with higher stock prices in the future. A dwindling MD results in lower prices.
Our BTI does not use a MA to appraise the trend of MD. It uses similar patterns as those applied by the Dow Theory to pinpoint the relevant highs and lows to be pierced to signal a change of trend. As with the Dow Theory, there is a minimum extent requirement for any movement to be meaningful.
If MD is such an effective timing device, shouldn’t we stop here? No, for two reasons:
- While favorable to higher stock prices, an upward trend for MD is not a guarantee against sudden downturns. The BTI protects against such drops in a two-fold manner: (a) Firstly, by having trailing stops based on confirmation which change depending on the market condition; (b) secondly, by rejecting an entry when, despite a positive trend for MD, the internals of the market are weak.
- TIME is essential to making money in the markets. Roughly 34.5% of the time, MD is in a bearish mode. However, during such instances of bearishness, there are spells of market bullishness. The critical issue is to detect when an investable bullish episode is likely to occur within a bearish MD to increase the bottom line. Here comes into play the second element of the BTI.
So, let’s take a look at the second component of the BTI. Relative strength between market sectors can forecast the most probable price action. The less the market favors defensive sectors (i.e., utilities), the more likely higher prices are ahead. When defensive sectors are the strongest, the implications for the whole market are bearish. This fact has been thoroughly researched (“An Intermarket approach to Beta Rotation”, Michael Gayed, 2020). So, even when the trend of MD is bearish, if aggressive sectors are stronger than defensive ones, we’ll get a bullish reading, and it pays off to return to the market.
Relative strength between sectors also helps us to time our exits. When defensive sectors outperform aggressive ones, it is time to tighten our stops.
While the BTI’s makeup is proprietary, it is not subject to individual interpretation. As with all good timing indicators (more about good “timing indicators HERE”), the BTI may give a signal every day, as it is based on daily bars. However, also as with all good timing indicators, it triggers seldom, given that the average duration of a BTI trade is 511 days.
Bottom Line: The BTI is a successful addition to the Dow Theory for the 21st Century. While both indicators usually result in close signal dates, they are constructed differently, providing diversification. The BTI is constructed through mathematical calculations of relative strength, momentum, and margin debt trend, whereas the external chart patterns determine the Dow Theory. In my humble opinion, these are the two premier stock market major trend timing indicators with documented long-term records that set the standard for market timing. While we certainly endorse this excellent indicator on a stand-alone basis, we also include it in our COMPOSITE Timing Indicator, which is the synergistic combination of the Dow Theory and the Blay Timing Indicator. Synergy: “The interaction of two or more agents or forces so that their combined effect is greater than the sum of their individual effects”.
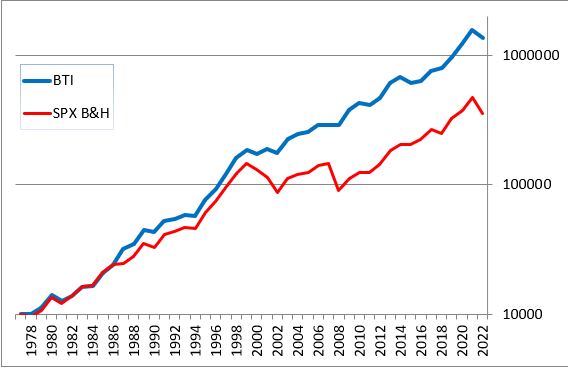
Below you have the comparison on an annual basis between the BTI applied to the S&P500 and Buy and Hold (based on pure price action. Total return figures are being elaborated and will be posted soon). A start equity of $ 10,000 on 7/6/1978 would have become on 10/14/2022 $1,365,416 versus only 358,438 for B&H.

The results are hypothetical and are NOT an indicator of future results and do NOT represent returns that any investor attained.
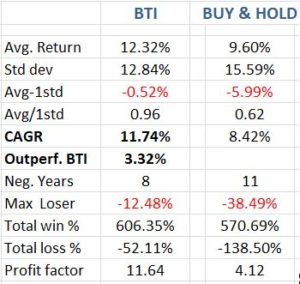
The Table below summarises the key performance figures:

You can see that the BTI beats B&H on all counts: much higher Profit Factor, total percentage won/lost, Maximum Losing Year, number of negative years, CAGR, etc.
Do you want to continue reading?
Do you want to see the specific trades taken, more valuable statistics and be informed when the BTI signals a new trend?
Become a Subscriber, and you’ll have access to the full Special Report.
Additionally, your subscription will give you a wealth of information (i.e., access to our Letters since 1962 and their accompanying trade recommendations, the power of the consumer confidence report as a timing device, the special report about the yield curve, how to calculate profit objectives that work, trend assessment for gold, silver and their ETF miners -GDX & SIL- and much more). More importantly, you’ll be punctually updated through our email service of any change in the trends for US stock indexes. Not accidentally, our Newsletter has consistently been ranked among the top investments Letters.
