31 BULL MARKETS

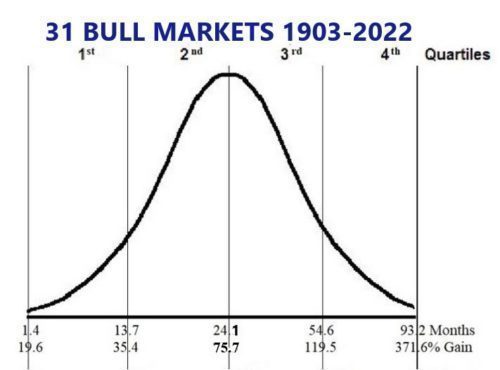
The BOTTOM LINE: You can see the shortest and longest Bull markets were 1.4 and 93.2 months respectively. The least gain was 19.6% and the most 371.6%. The median of all 31 complete Bull markets was a 75.7% gain and lasted 24.1 months. This gives you an historic perspective of where any particular Bull market stands in relation to others, and where a current Bull market’s status might be. Bull (or Bear) markets can end at any point but the quartiles show the “odds” of when they might end.
31 BEAR MARKETS

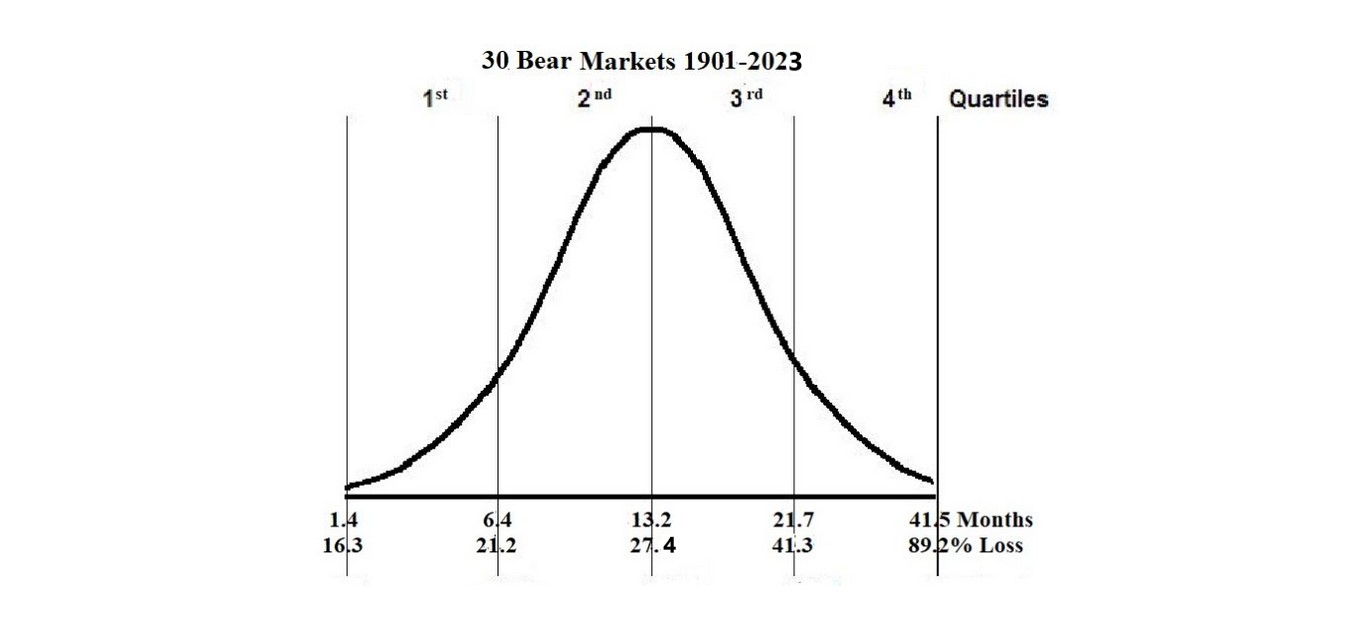
The BOTTOM LINE: The shortest Bear market lasted only 1.4 months, and the longest 41.5 months. The least decline was 16.3%, the most 89.2%. The median of all 31 complete Bear markets was a 27.4% decline and lasted 13 months. Current markets can be plotted on these Bell Curves to get an idea of where they may be in their life cycle, and the odds of continuance.
