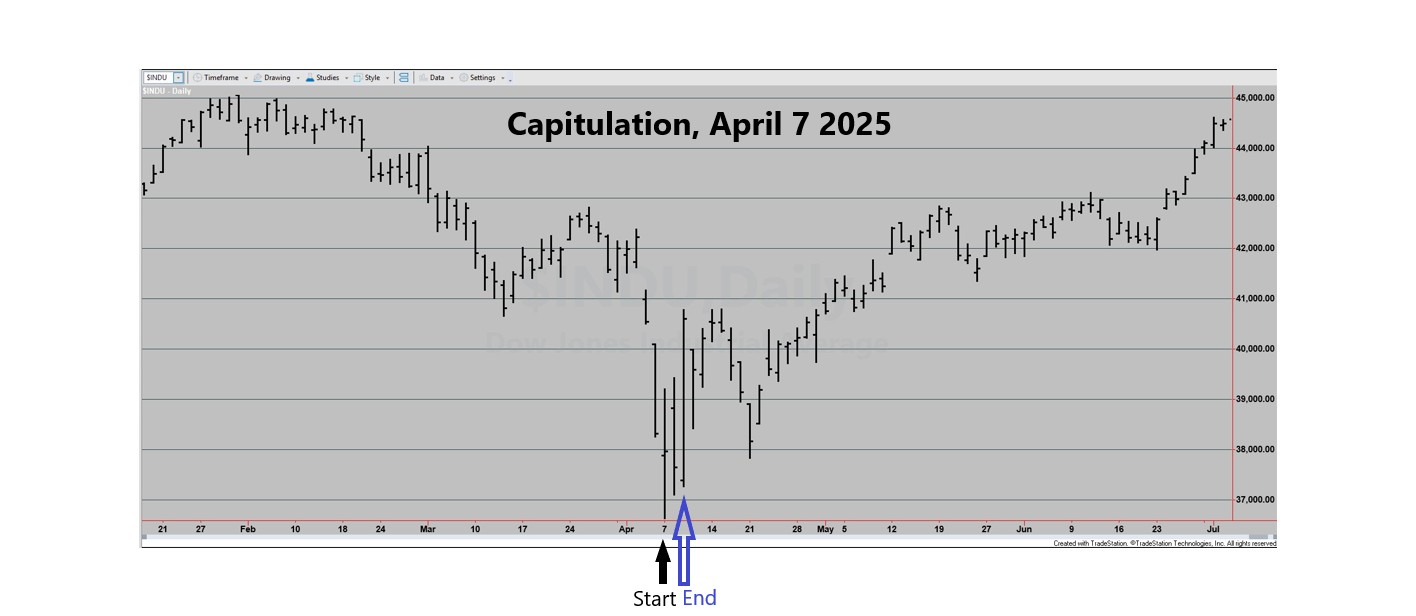
When I was a young broker at Dean Witter in the 1960s, they formed a department called COMPARE (Computer Assistance to Research). One of the calculations they made back then, and which I have kept up to date since that department went kaput years ago, has to do with a short-term oscillator that measures the percent of divergence between the three major stock market indices (DJIA, S&P500, and the NYSE Composite), and their time-weighted moving averages. When two of the three indices are simultaneously in double digits below those respective moving averages, we have Capitulation. The most recent occurrences of Capitulation are shown below. The 18 dates, market levels, and the subsequent returns over various timeframes are shown below. You’ll see that the end of the last 11 bear markets (save the one finished in October 2022) were signaled, and 3 of the 7 before that. Some bear markets end, however, with a whimper, like the one in 2022, hence no Capitulation indication.

| Date | S&P500 Level | Days* | % | 6 months | 1 Year | 3 Years | 5 Years |
|---|---|---|---|---|---|---|---|
| 22-Jun-62 | 52.68 | 2 | 0.6 | 18.9 | 33.4 | 61.8 | 48.5** |
| 25-May-70 | 70.25 | 1 | 1.4 | 21.1 | 41.6 | 53.7 | 43.6** |
| 23-Aug-74 | 71.55 | 28 | 13.0 | 15.5 | 17.8 | 36.4 | 26.0** |
| 30-Sep-74 | 63.54 | 3 | 2.0 | 31.1 | 32.0 | 51.9 | 41.9** |
| 19-Oct-87 | 224.84 | 0 | 0 | 14.7 | 23.2 | 38.9*** | 84.4 |
| 3-Dec-87 | 225.21 | 1 | 0.6 | 18.3 | 20.7 | 43.9*** | 90.9 |
| 23-Aug-90 | 307.06 | 34 | 3.8 | 19.1 | 28.4 | 48.3 | 81.4 |
| 31-Aug-98 | 957.28 | 0 | 0 | 29.4 | 37.9 | 20.2** | n/a |
| 20-Sep-01 | 984.54 | 1 | 1.7 | 17.0 | -6.5** | n/a | n/a |
| 19-Jul-02 | 847.76 | 57 | 8.4 | 6.4 | 17.2 | 45.0 | 83.2 |
| 9-Oct-02 | 776.76 | 0 | 0 | 11.5 | 33.7 | 54.0 | 101.5 |
| 7-Oct-08 | 996.23 | 32 | 20.0 | -18.1*** | 6.2 | 21.6 | 68.2 |
| 12-Nov-08 | 852.3 | 6 | 8.8 | 6.6*** | 27.6 | 48.3 | 107.4 |
| 23-Feb-09 | 743.33 | 10 | 8.0 | 31.3 | 47.3 | 83.4*** | 147.0 |
| 8-Aug-11 | 1,119.46 | 39 | 1.4 | 14.1 | 25.3 | 72.5 | 94.8 |
| 24-Dec-18 | 2,351.10 | 0 | 0 | 25.3 | 37.1 | 16.8** | |
| 9-Mar-20 | 2,746.56 | 10 | 18.5 | 23.7 | 41.1 | ||
| 7-April-25 | 5062.25 | 1 | 1.6 | 32.6 | N/A | N/A | N/A |
| Averages | 12.5 | 4.98 | 17.7 | 29.2 | 46.4 | 78.4 | |
| Median | 2.5 | 1.65 | 18.6 | 28.4 | 46.7 | 83.2 | |
The Schannep Capitulation Indicator Data from 31 December 1953 forward (available in real-time since 1969)
Trading days away and percentage down to S&P and/or DJIA Bear market lows
**Closed out due to Bear market definition (-16% on DJIA & S&P) being met during the period shown
***Not closed out at definition due to simultaneous new capitulation offset
