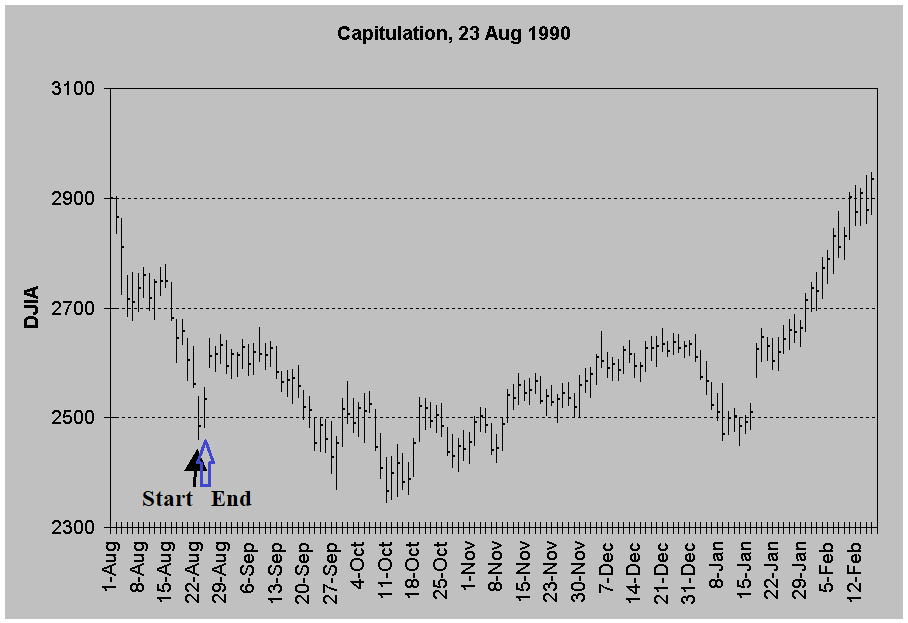
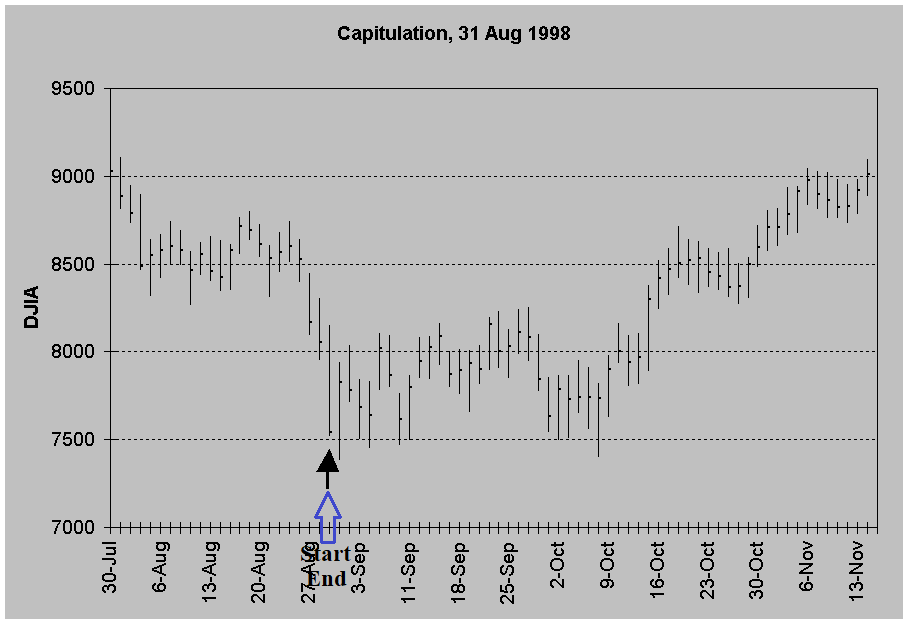
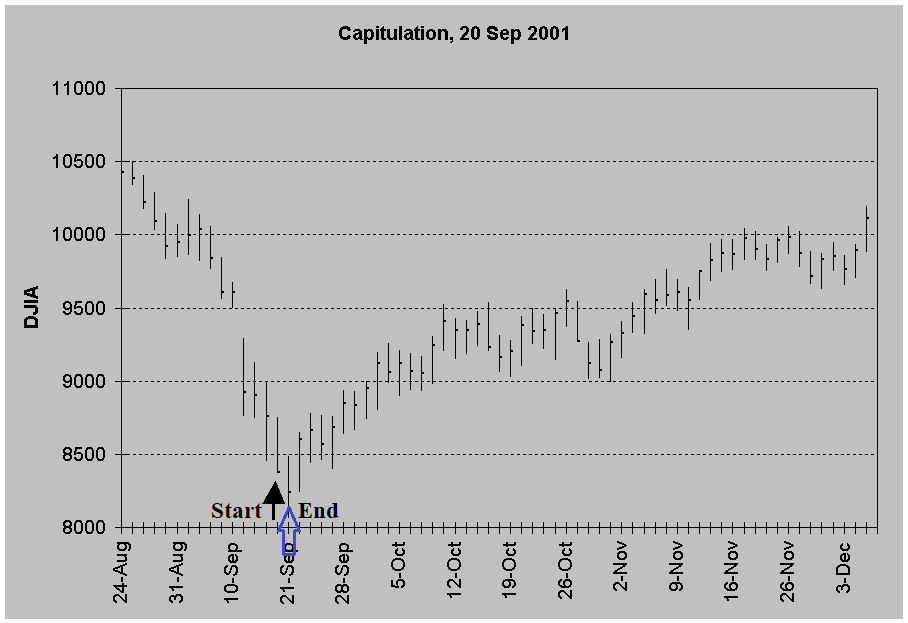
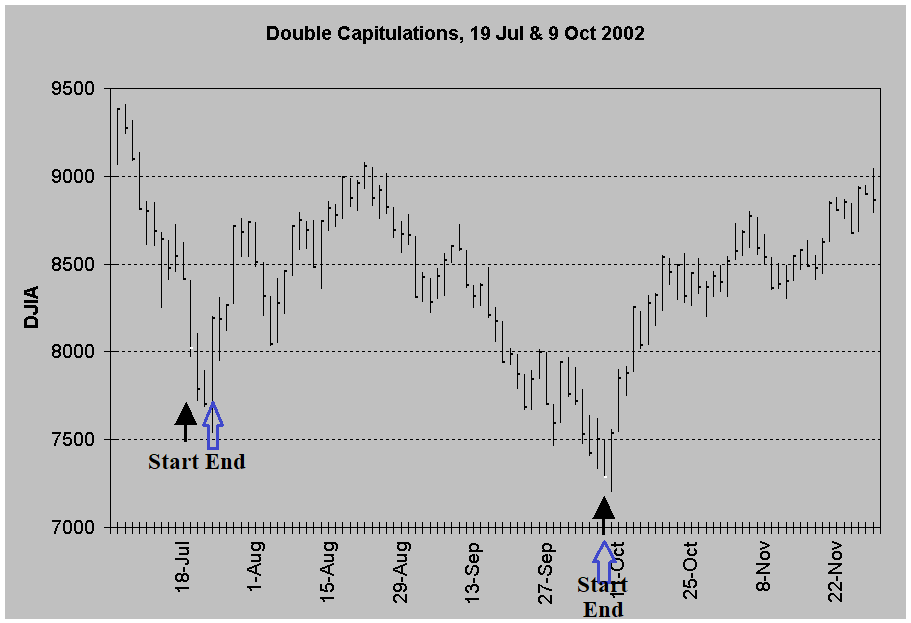
Capitulation as it relates to the stock market is when investors, speculators, whomever ‘throw in the towel’ because they are so disheartened, fearful, need to meet margin calls, or whatever. It is often called a ‘selling climax’ as stocks cascade down into a cataclysmic sell-off. The word ‘capitulation’ is not uttered in writings about the Dow Theory, but it was clearly alluded to in the early 20th century. The third phase of a bear market was described in “The Dow Theory” by Robert Rhea in 1932 as “caused by distress selling of sound securities, regardless of their value, by those who must find a cash market for at least a portion of their assets“. “After a market has drastically declined…and then goes into a semi-panic collapse, it is wise to cover short positions and even perhaps make commitments for long account“.
Turning the generality of capitulation into a specific identification has been tried by a number of systems. S&P Marketscope had done a couple of Special Studies on the subject, one using a CBOE “Equity-only Put/Call Ratio”, and another study of “New 52 Week Lows as a Percentage of Total Issues Traded”. Both studies are impressive and in their own words “worthy of consideration”. Some use TRIN, also known as the Arms Index, involving the ratio of advancing stocks to declining issues by the ratio of advancing volume to declining volume. Others use the CBOE Market Volatility Index, and there are many contrary indicators also used to try to divine levels of capitulation. Art Hogan, chief market analyst at Jefferies & Co. has been quoted as saying “You don’t gauge it until you see the market head higher. Individual investors shouldn’t try to time it”.
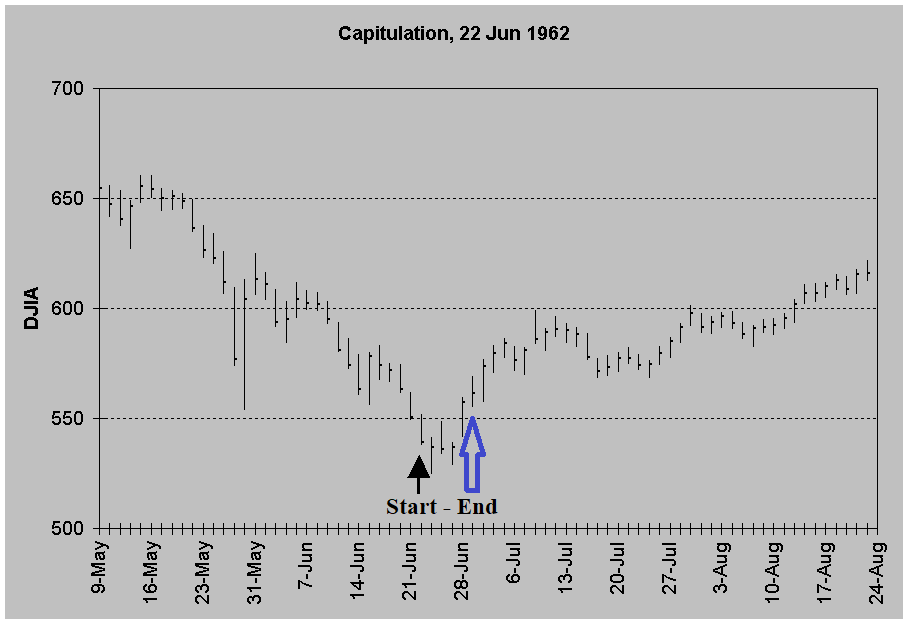
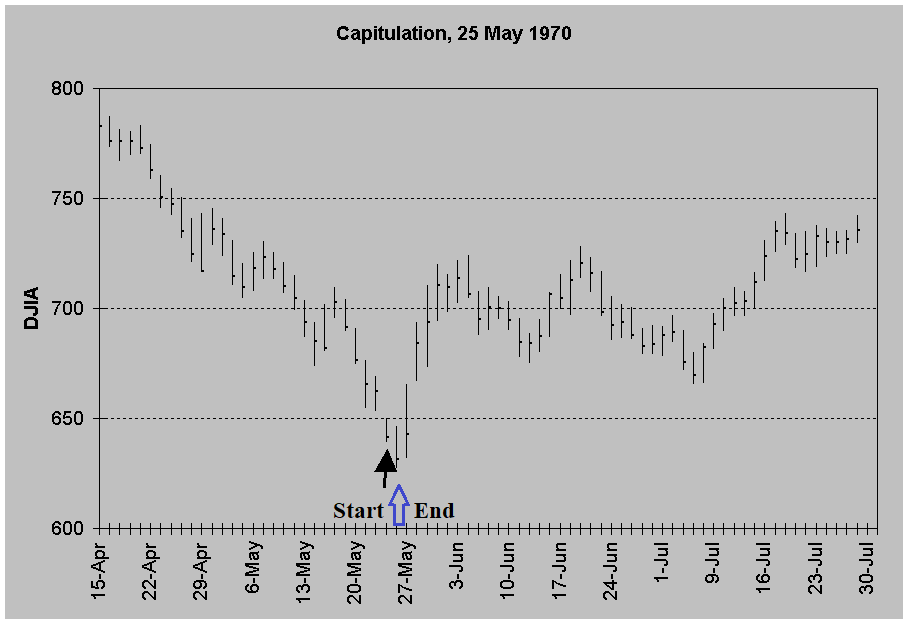
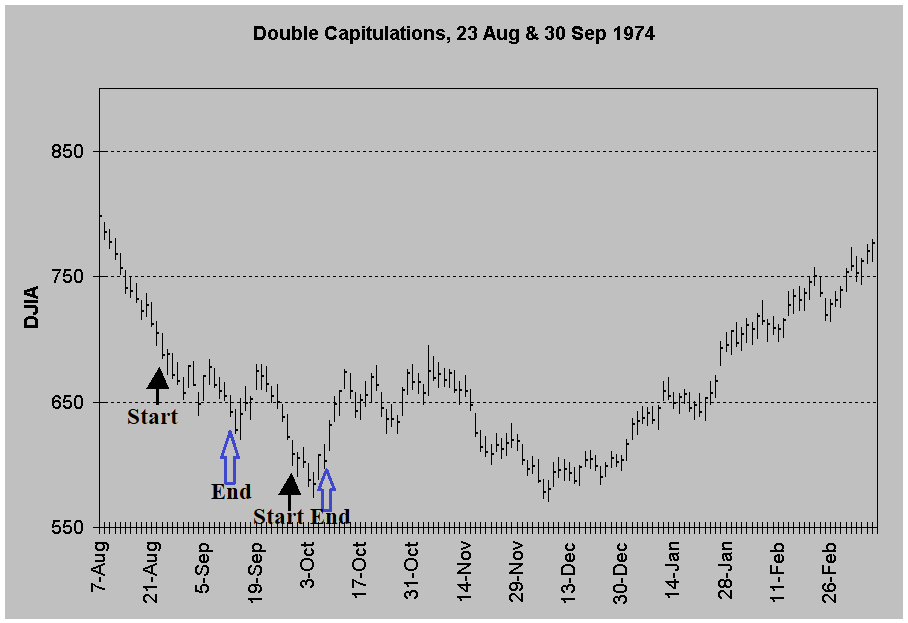
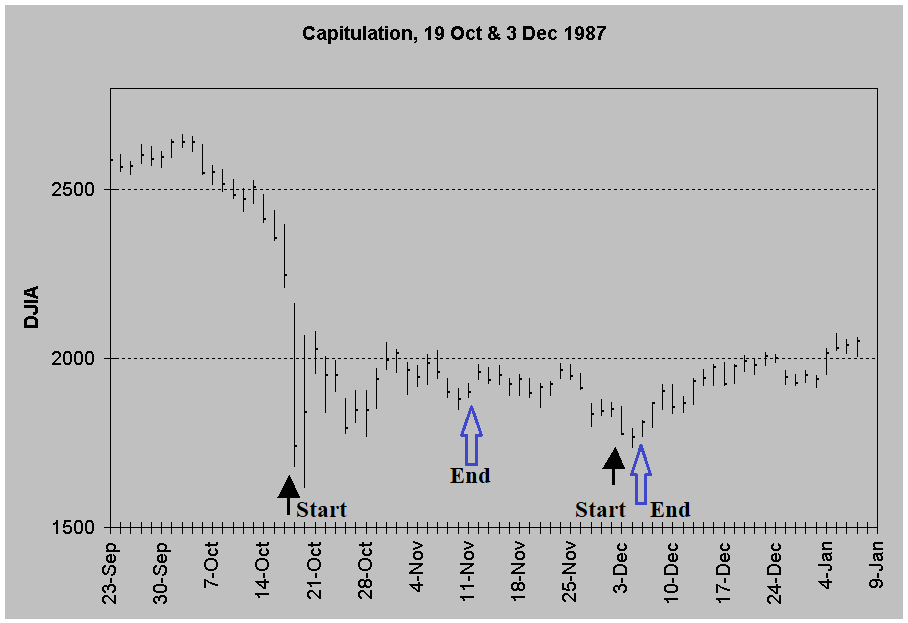
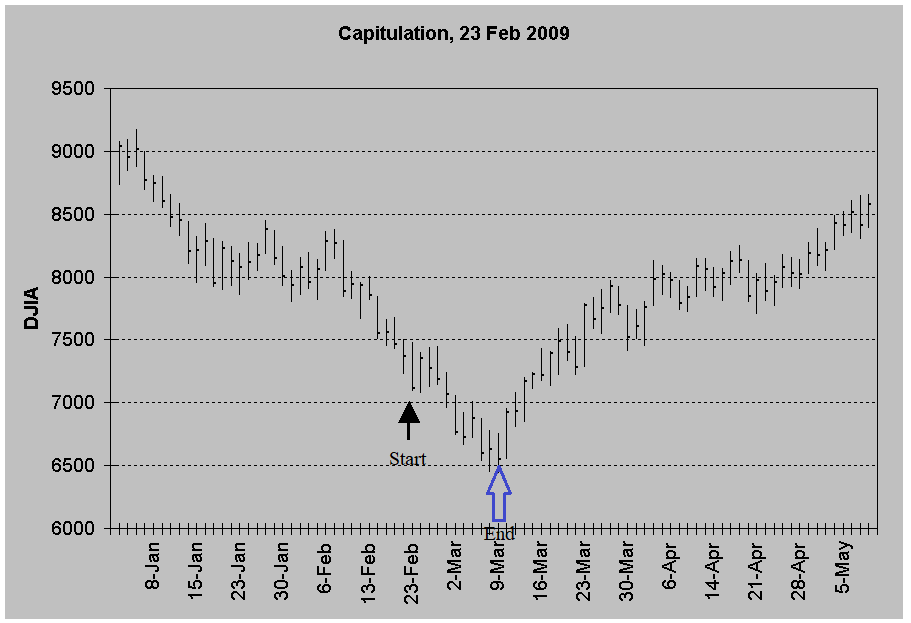
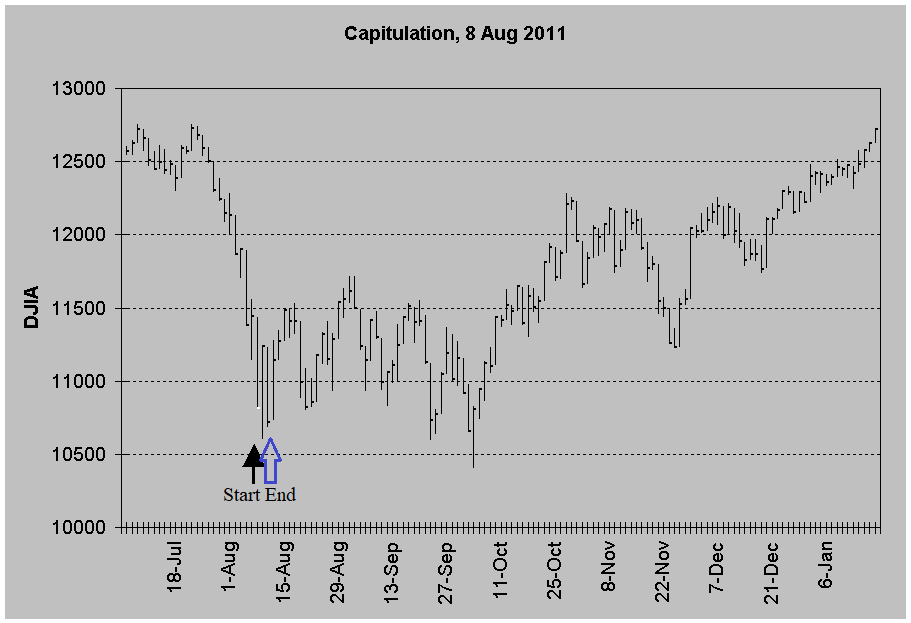
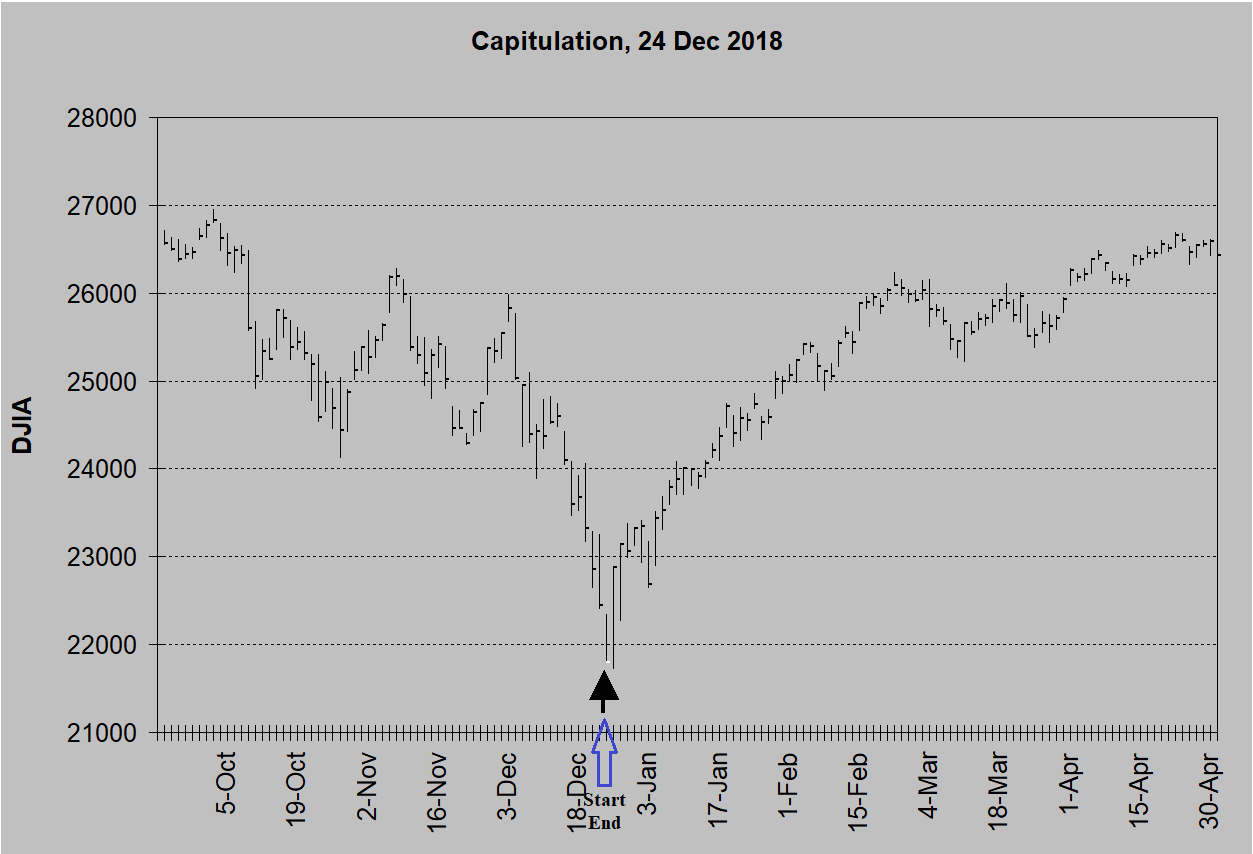
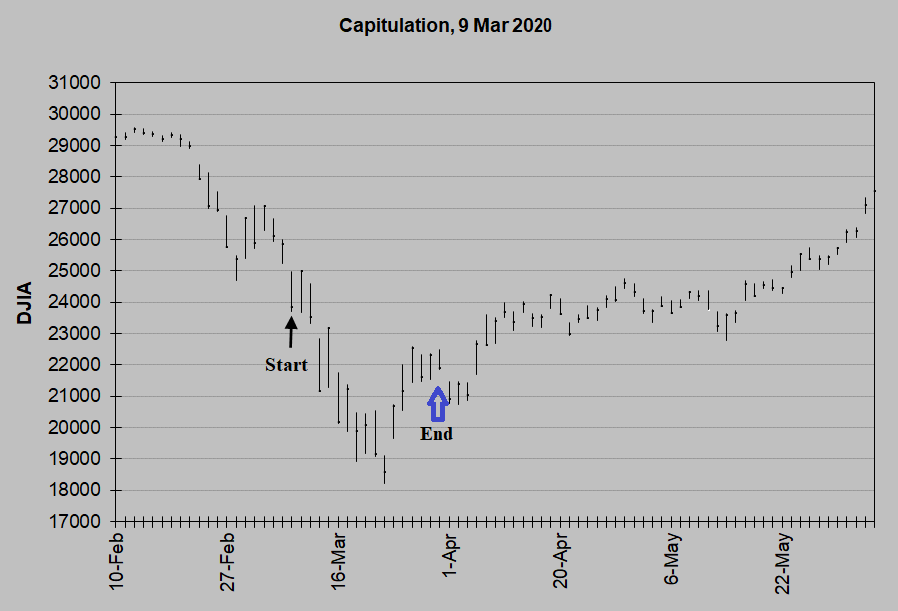
In fact, in can be measured and identified quite specifically. There have been 18 times since my database began in 1953 that this indicator signaled complete capitulation. Those times when they reached total capitulation are shown below using the first day that capitulation was reached, sometimes that is the only day of capitulation but on most the status lasts for several days, if not weeks. The first day averaged within 4.99% (median 1.65%) and 12.5 days (median 2.5 days) before the bear market lows, 4 were on the actual low day, 4 were 1 day early and 1 was 2 days before the lows. (Only 6 times of the 18 capitulations was the low over 4% lower).
The Schannep Capitulation Indicator
Data from 31 December 1953 forward (available in real-time since 1969)
| Date | S&P500 Level | Days* | % | 6 months | 1 Year | 3 Years | 5 Years |
|---|---|---|---|---|---|---|---|
| 22-Jun-62 | 52.68 | 2 | 0.6 | 18.9 | 33.4 | 61.8 | 48.5** |
| 25-May-70 | 70.25 | 1 | 1.4 | 21.1 | 41.6 | 53.7 | 43.6** |
| 23-Aug-74 | 71.55 | 28 | 13.0 | 15.5 | 17.8 | 36.4 | 26.0** |
| 30-Sep-74 | 63.54 | 3 | 2.0 | 31.1 | 32.0 | 51.9 | 41.9** |
| 19-Oct-87 | 224.84 | 0 | 0 | 14.7 | 23.2 | 38.9*** | 84.4 |
| 3-Dec-87 | 225.21 | 1 | 0.6 | 18.3 | 20.7 | 43.9*** | 90.9 |
| 23-Aug-90 | 307.06 | 34 | 3.8 | 19.1 | 28.4 | 48.3 | 81.4 |
| 31-Aug-98 | 957.28 | 0 | 0 | 29.4 | 37.9 | 20.2** | n/a |
| 20-Sep-01 | 984.54 | 1 | 1.7 | 17.0 | -6.5** | n/a | n/a |
| 19-Jul-02 | 847.76 | 57 | 8.4 | 6.4 | 17.2 | 45.0 | 83.2 |
| 9-Oct-02 | 776.76 | 0 | 0 | 11.5 | 33.7 | 54.0 | 101.5 |
| 7-Oct-08 | 996.23 | 32 | 20.0 | -18.1*** | 6.2 | 21.6 | 68.2 |
| 12-Nov-08 | 852.3 | 6 | 8.8 | 6.6*** | 27.6 | 48.3 | 107.4 |
| 23-Feb-09 | 743.33 | 10 | 8.0 | 31.3 | 47.3 | 83.4*** | 147.0 |
| 8-Aug-11 | 1,119.46 | 39 | 1.4 | 14.1 | 25.3 | 72.5 | 94.8 |
| 24-Dec-18 | 2,351.10 | 0 | 0 | 25.3 | 37.1 | 16.8** | |
| 9-Mar-20 | 2,746.56 | 10 | 18.5 | 23.7 | 41.1 | ||
| 7-April-25 | 5062.25 | 1 | 1.6 | 32.6 | N/A | N/A | N/A |
| Averages | 12.5 | 4.98 | 17.7 | 29.2 | 46.4 | 78.4 | |
| Median | 2.5 | 1.65 | 18.6 | 28.4 | 46.7 | 83.2 | |
*Trading days away and percentage down to S&P and/or DJIA Bear market lows
**Closed out due to Bear market definition (-16% on DJIA & S&P) being met during the period shown
***Not closed out at definition due to simultaneous new capitulation offset
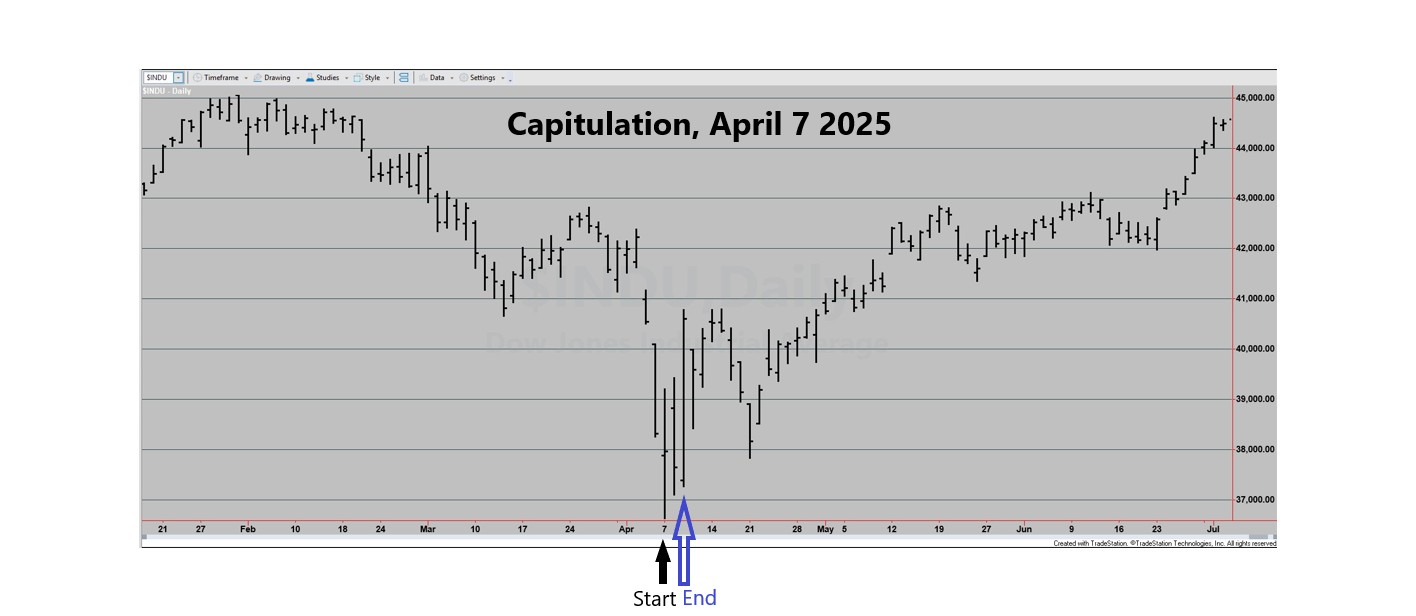
The calculations that determine these capitulations are rather complex and are proprietary. I can tell you however, that they utilize a Short-term Oscillator which measures the percent of divergence between the three major stock market indices (Dow Jones Industrial Average, Standard&Poor’s 500 and the New York Stock Exchange Composite) and their ten-week, time-weighted moving averages. They can be calculated during a trading day but are determined by closing prices. For instance, the markets were in total capitulation during the day on 3/21/01 while the Dow Jones was between 9,100 and 9,300, but not on a closing basis. Yes, the market then bounced to over 11,300 in 8 weeks but the record of such partial/incomplete capitulations is not sufficiently dependable to warrant acting on it every time. Other partial/incomplete capitulations have been followed by further declines of over 22% on three different occasions, hardly a confidence builder. But total capitulation on a closing basis is a unique happening, certainly valuable information to know about and act upon, and we e-mail subscribers whenever that happens.
Unfortunately, capitulation doesn’t happen at every bear market bottom. Including the first of the total capitulations in my data-base at the 1962 bottom there have been 18 bear markets with 13 lows signaled by total capitulation, and 1 by partial capitulation. The other four (1966, 1978, 1982 and 2022) had some movement toward capitulation but did not even reach the level of partial capitulation, therefore 5 of the 18 bottomed without total capitulation. Subscribers have been advised when the market was approaching capitulation, and were e-mailed on the day of the last eleven occasions (since this Letter became available on the Internet). And the good news “About . . (total) Capitulation” is that it is identifiable and ends bear markets!

