The “Rule of Seven” came to my attention in recent years, and my initial review of the “Rule” prompted my mention of it in the December 2013 and January 2014 Letters. As a Dow Theorist, I must remind you that one of the theorems of the Dow Theory is that “there is no known method of forecasting the extent or duration of a primary movement”, and yet we all try. The “Rule of Seven” may be helpful in filling the void that we all have of setting targets for bull markets, and that is the basis for this Special Report. (And no, this is not the “Rule of 72” which is used to see how long it will take for something to double at different growth rates. You remember: if something was growing at [pick a percentage], you would divide 72 by that rate to get the time to double. For instance, 72/10%=7.2 years, 72/5%=14.4 years, etc). After my mention in our Letters, many Subscribers wanted to know more about it, particularly after the first S&P500 target level of 1658.90 which had been attained in May of 2013 was followed by the next target level of 1845.45 subsequently attained in December of that year. What follows in a different typeset is the total sum and substance of what is known about the Rule, excerpted from Techniques of a Professional Commodity Chart Analyst, by Arthur Sklarew (1980), with permission from the Publisher: Commodity Research Bureau, Inc:
p.74 – One method (for projecting price objectives), the Rule of Seven, came briefly to my attention many years ago, but appears to be unknown to most chartists.
p.82 – There appears to be no rhyme nor reason to the Rule of Seven, but it is often surprisingly accurate in its predictions. It is based on the assumption that the initial leg of a new price trend reflects the potential power of the changing forces of supply and demand sufficiently to serve as a guide to the probable extent of the price move. Put another way, using the Rule of Seven, a measurement of the initial leg of the trend is all the information needed to project one or more objectives in the direction of a new trend. Numerous tests that I have made over the years have revealed that the formula for measuring upside objectives by the Rule of Seven must be varied slightly when applied to downside objectives. I have also observed some special characteristics of the Rule of Seven under varying trend conditions, which will be described here.
p.83 – In an uptrend the basic formula is: Measure the size of the initial up-leg by subtracting the low price from the high; multiply that figure by seven; then divide that product by four to get the distance from the low to the first objective, divide the product by three for the second objective, and by two for the third objective. Note that for each of the three objectives the respective distance figure is added to the low. The formula can be simplified as follows:
Upside objective #1: High minus low, multiply by 1.75 (i.e., 7/4), add to low price.
Upside objective #2: High minus low, multiply by 2.33 (i.e., 7/3), add to low price.
Upside objective #3: High minus low, multiply by 3.50 (i.e., 7/2), add to low price.In a downtrend the formula is moved back one notch. The three downside objectives are obtained by multiplying the size of the initial down-legs by 7/5, 7/4. And 7/3, or 1.40, 1.75, and 2.33 respectively, and subtracting the result from the high.
One of the special characteristics I have observed is that in a measurement of the minor trend, the first and second objectives are often ignored by the market, and the third objective is generally reached without any significant pause along the way. A minor-trend measurement might be defined as one in which the initial leg of the new trend is completed within about six days, and might even be as brief as one or two days. In a major trend measurement, when the initial leg takes weeks or perhaps months to be completed the first objective is usually the valid target. A second characteristic I have observed is that if a major move continues much beyond the first objective without correcting, it is likely to stop at the second objective. As a rule of thumb, the greater the magnitude of the trend, the more likely it is to stop at the first objective, while trends of small magnitude are likely to skip the first objective and sometimes the second as well.
p.84 – A third characteristic is that in dynamic markets a fourth objective must be considered. In an uptrend, the fourth objective is seven times the initial leg projected upward from the low of that leg. In a downtrend it will be 3.50 times the first leg projected downward from the high. As with all objective measurements, the projections of the Rule of Seven are given greater weight if they coincide approximately with one or more other objective measurements.
p.133- I have chosen to emphasize trendlines and the Rule-of-Seven measurements, as they appear to be especially effective on weekly charts. Rule-of-Seven measurements can be applied to weekly charts in much the same way that they are used on the daily charts, as described (previously). It will be recalled that the size of the first “leg” of the new trend is the only information needed to calculate price objectives using the Rule of Seven. The question of whether to look for the first objective – or the second, third, or fourth – is determined largely by the relative size of the first leg.
p.134- As a general rule, a small initial price swing projects a third or possibly a fourth objective, while a large initial price move calls for only a first or second objective. As on the daily charts, if the first leg of a new trend on the weekly chart consists of just a few overlapping weekly ranges, the third objective or possibly the fourth is the target indicated. If the initial leg is a minor move that consists of just a few weekly ranges in a fast, steep move, the second objective may be as far as prices will go on the next run. When the initial leg is relatively large, consisting of a series of zigzag swings, the next move will usually carry only to the first objective. These are all relative comparisons, and one must learn to use judgment, tempered by experience, when setting a target. Rule-of-Seven measurements, like all other technical indicators, should be confirmed by one or more other technical indicators.
And so, there you have it. The Rule of Seven gets its name from the use of the number ‘seven’ as the numerator in the formula. It seems simple, although there are aspects that are not clear, such as the “relative size” of the first leg, whether it is a “small initial price swing” or “relatively large”, the “greater magnitude of the trend” means exactly what? “Minor trend” might be 6 days or less, or “just a few weekly” ranges seems a contradiction but appears to depend on whether one is using a daily chart or a weekly one, which is his preferred timeframe (“Rule-of-Seven measurements… appear to be especially effective on weekly charts”). The description of “size of the initial up-leg by subtracting the low price from the high” would seem to imply intraday or intraweek levels as opposed to closing prices. I have tended to use the closing low or high of the days that marked those levels on a closing basis. That might not always be the intraday or intraweek low or high if those were obtained a day or two before or after. Any differences would seem so minor in what is, at best, a guestimate, therefore the target levels should not be expected to be precise right down to the decimals. What is perfectly clear is that “one must learn to use judgment, tempered by experience, when setting a target”.
As I have written in my Newsletter, “I don’t know what these simple calculations are based upon” but since they seem to work…“often surprisingly accurate”, as Sklarew wrote, I am presenting the rule here. It has been suggested elsewhere that a Fibonacci series is embedded in the “rule” and that new targets come into play when the earlier target has been exceeded by 3%, but note neither idea is advanced in the original description by Sklarew. There are several examples of the use of the Rule as it relates to commodity charts in Sklarew’s book, but our primary interest is its relevance for the stock market, therefore I show below its predictive powers in recent bull markets.
This first chart uses the first short-term minor leg (it lasted less than a month) for its measurement of “Targets” and you’ll see that Target “A” worked out well and while “B” and “C’ were attained they were not impressively delineated:
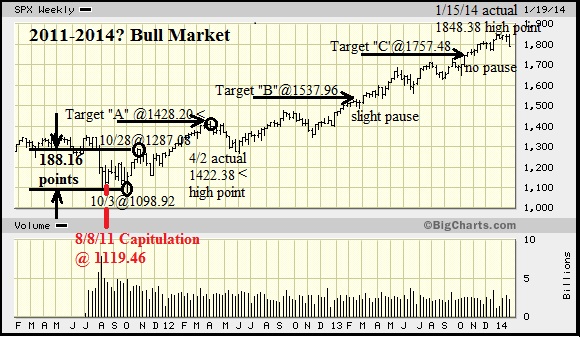 The calculation for the S&P500 Targets are:
7/4 x 188.16 (the initial leg) = 329.28 + 1098.92 (low point) = 1428.20 for Target “A”
7/3 x 188.16 = 439.04 + 1098.92 = 1537.96 for Target “B”
7/2 x 188.16 = 658.56 + 1098.92 = 1757.48 for Target “C”
By contrast, using the longer initial major leg (Target “A” from the above) the subsequent Targets “A” and “B” were excellent (shown below). The advantage of having the two approaches is that after the first Target “A”, i.e. the longer leg is established, then you can see what targets could be determined by using that major leg (which lasted 6 months). This updating of the calculations resulted in far better targets than the initial calculations.
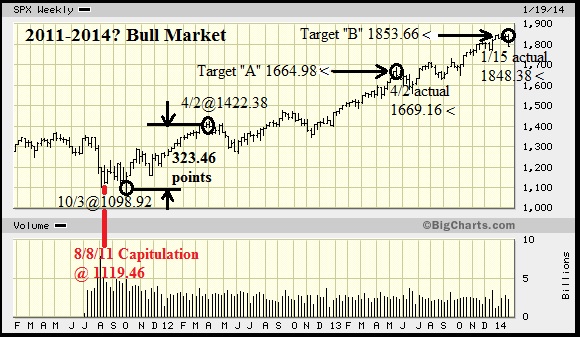 The calculations for the above targets/objectives are as follows:
7/4 x 323.46 = 566.06 + 1098.92(low point) = 1664.98 target “A”
7/3 x 323.46 = 754.74 + 1098.92 = 1853.66 target “B”
Target “B” then had a 100+point (on the S&P500 Index) secondary reaction setback which clearly defined it. AFTER the market recovered from its setback and proceeded to make newer highs THEN the next target would come into play: 7/2 x 323.46 = 1132.11 + 1098.92 = 2231.03 target “C” which was attained December of 2016.
In the above charts I have shown the Capitulation that signaled that this bear market low was approaching, as it has done for the last ten bear market lows.
The low point to determine the start of this 2011-2018 bull market had been preceded by a brief bear market which met our definition of -16% on each of the Dow Industrials and the S&P500, as well as our definition of ‘Capitulation’.
Next, let’s look at the previous bear market:
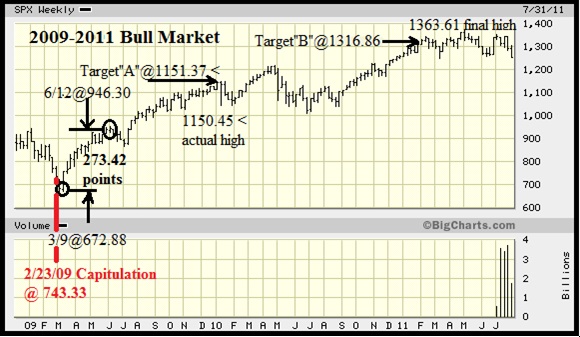 The three month initial leg was chosen above, rather than the ten month to what became Target “A” or the thirteen month to 1217.28. It turns out that Targets chosen from those much longer legs would have been negated by the brief, but well defined Bear market which started on April month-end, 2011.
Additionally, by way of backtesting, let’s look at the earlier 2002-7 Bull market:
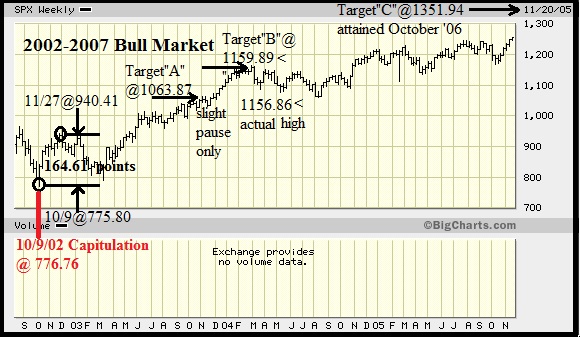 As you can see in the chart above, the initial leg was only 7 weeks in length but the alternative leg was a year and a half long, not a viable option. Sometimes the initial leg is not clear at all, for instance in the 1998-2000 Bull market the first leg was very short at just over 3 weeks, but since Sklarew wrote it could be “just a few weekly ranges”, that is the one to use (the only alternative would be the top at Target “C”, some 10 ½ months later). Of course, a short leg yields closer targets than a long one would. By being so short, the chart is unfortunately compressed and hard to read – sorry about that. Clearly this qualifies as a ‘minor leg’, about which Sklarew wrote: “One of the special characteristics I have observed is that in a measurement of the minor trend, the first and second objectives are often ignored by the market, and the third objective is generally reached without any significant pause along the way”. This one fills that bill!
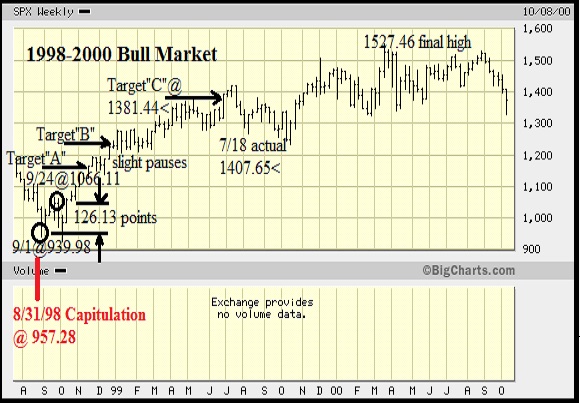 Interestingly, this initial leg was followed by the pullback that defined its top and dropped below the first low. Ordinarily that would preclude it from being the first/initial leg, but the Dow Industrials did not drop to new lows AND a Capitulation had preceded it, so we could see at the time, as well as in hindsight, that the Bear market had ended and this was the initial leg of a new Bull market.
Now to bring this report up-to-date, let’s look at the calculations for the 2018-20 Bull market’s top: The first leg up from the most recent Bear market bottom on Christmas Eve, 2018 when we got the capitulation BUY signal was at the 21,792.20 level (NOTE we are using the Dow Industrials -DJIA- in this example). The run-up to the start of the first pullback on February 25th of 2019 was to 26,091.95 for a gain of 4,299.75 points. The Rule of Seven multiplies those points by seven and then divides it by four (7/4) giving an answer of 7,524.56 points, which are then added to the starting point of 21,792.20, giving us a target of 29,316.76. FYI, the Bull market top was at 29,551.42 on February 12th, 2020. Chart from our May 2019 Letter: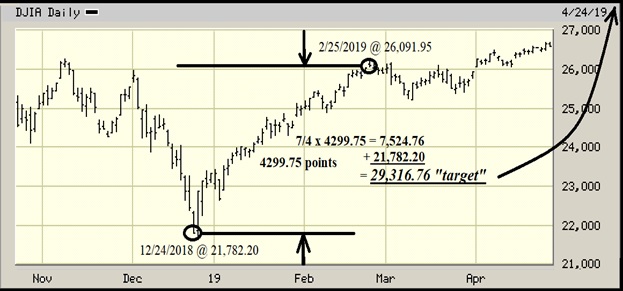 After the Bear market of 2020 shown below, we used a VERY minor trend timeframe, but a 3,960 point advance on the Dow Industrials (DJIA), to determine a Target “A” being 25,522.35. (2925 for the S&P500). Chart from our May 2020 Letter:
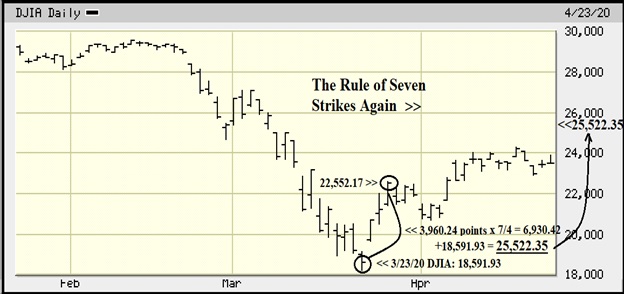 As a 3 day bounce is suspect, we moved on using the S&P500 on this next chart. Using the previous target for the S&P500 of 2925 being met as the new top of the bounce, came up with the following:
 The S&P500 first hit 3466.08 on August 26th, 2020 and continued to overshoot that target by 3.3% when it “topped” at 3580.80, before dropping 9.6%. Following that target having been met the calculation moves to Target “B”: The calculations of 7/3 x 702.11 points from the low to the bounce high = 1,638.26 added to 2,237.39 = 3,875.65. The market went right on through that target, but had two secondary reactions prior to reaching Target “C” which was calculated as 4,694.78. The market then exceeded that target by 101 points (2.1%) at 2021 year-end.
For a further discussion on the Rule of Seven from another source you might find the following article of interest: http://www.edwards-magee.com/ggu/ruleofseven.pdf
