

Overview: According to Dow Theory, the gold and silver miners ETFs, GDX and SIL, have turned bullish again. Gold and silver themselves, however, remain in a bullish secondary reaction and are still relatively far from triggering a new bull market signal. Nevertheless, my research shows that miners tend to lead the underlying metals, making their renewed strength a potentially encouraging sign.
General Remarks:
In this post, I provide an in-depth explanation of the rationale behind employing two alternative definitions to evaluate secondary reactions.
SIL refers to the Silver Miners ETF. More information about SIL can be found HERE.
GDX refers to the Gold Miners ETF. More information about GDX can be found HERE.
- A) Market situation if one appraises secondary reactions not bound by the three weeks and 1/3 retracement dogma.
As I explained in this post, the trend was signaled as bearish on 6/9/26.
Following the 7/20/26 lows there was a secondary (bullish) reaction against the bear market.
The rally was so strong that, without any meaningful pullback, it surpassed the previous secondary reaction highs (deep blue rectangles on the left in the charts below).
The rally was so strong that, without any meaningful pullback, it surpassed the previous secondary reaction highs (deep blue rectangles on the left in the charts below).
According to Dow Theory (Rhea’s book The Dow Theory, page 77), the breakup of the highs of the last completed secondary reaction serves as an alternative way to signal a new bull market (and, alternatively, the lows of the last completed secondary reaction serve as the relevant prices to monitor for a new bear market). You can get more information about this alternative signal HERE, HERE, and HERE.
The charts below show the most recent price action: the deep blue rectangles on the left display the previously completed secondary reaction. Their respective closing highs, highlighted by the blue horizontal lines, were the hurdles both ETFs had to surpass for a new primary bull market signal. The light blue rectangles show the secondary reaction against the bear market, which, without any meaningful pullback, pushed higher until breaking above the highs of the previous secondary reaction. The thick red horizontal lines on the right of the charts show the last recorded bear market lows, which, if pierced by both ETFs, would signal a new bear market.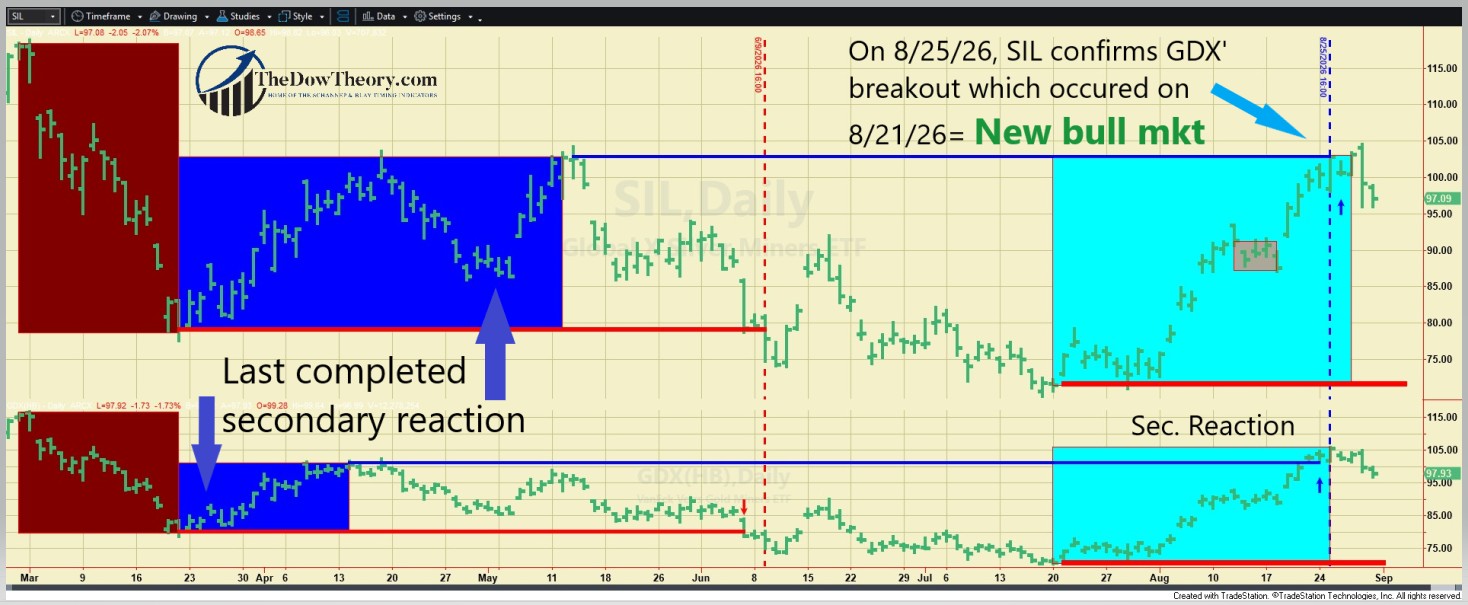
The table below gives you the relevant prices whose joint violation would signal a new bear market.

So, the primary and secondary trends are bullish.
B) Market situation if one sticks to the traditional interpretation demanding more than three weeks and 1/3 confirmed retracement to declare a secondary reaction.
As I explained in this post, the trend was signaled as bearish on 6/9/26.
In this instance, the longer-term application of Dow Theory yields the same result: the trend shifted to bullish on 8/25/26.
Sincerely,
Manuel Blay
Editor of thedowtheory.com