I thank Matthew Fox for quoting my Dow Theory analysis in “Markets Insider”.
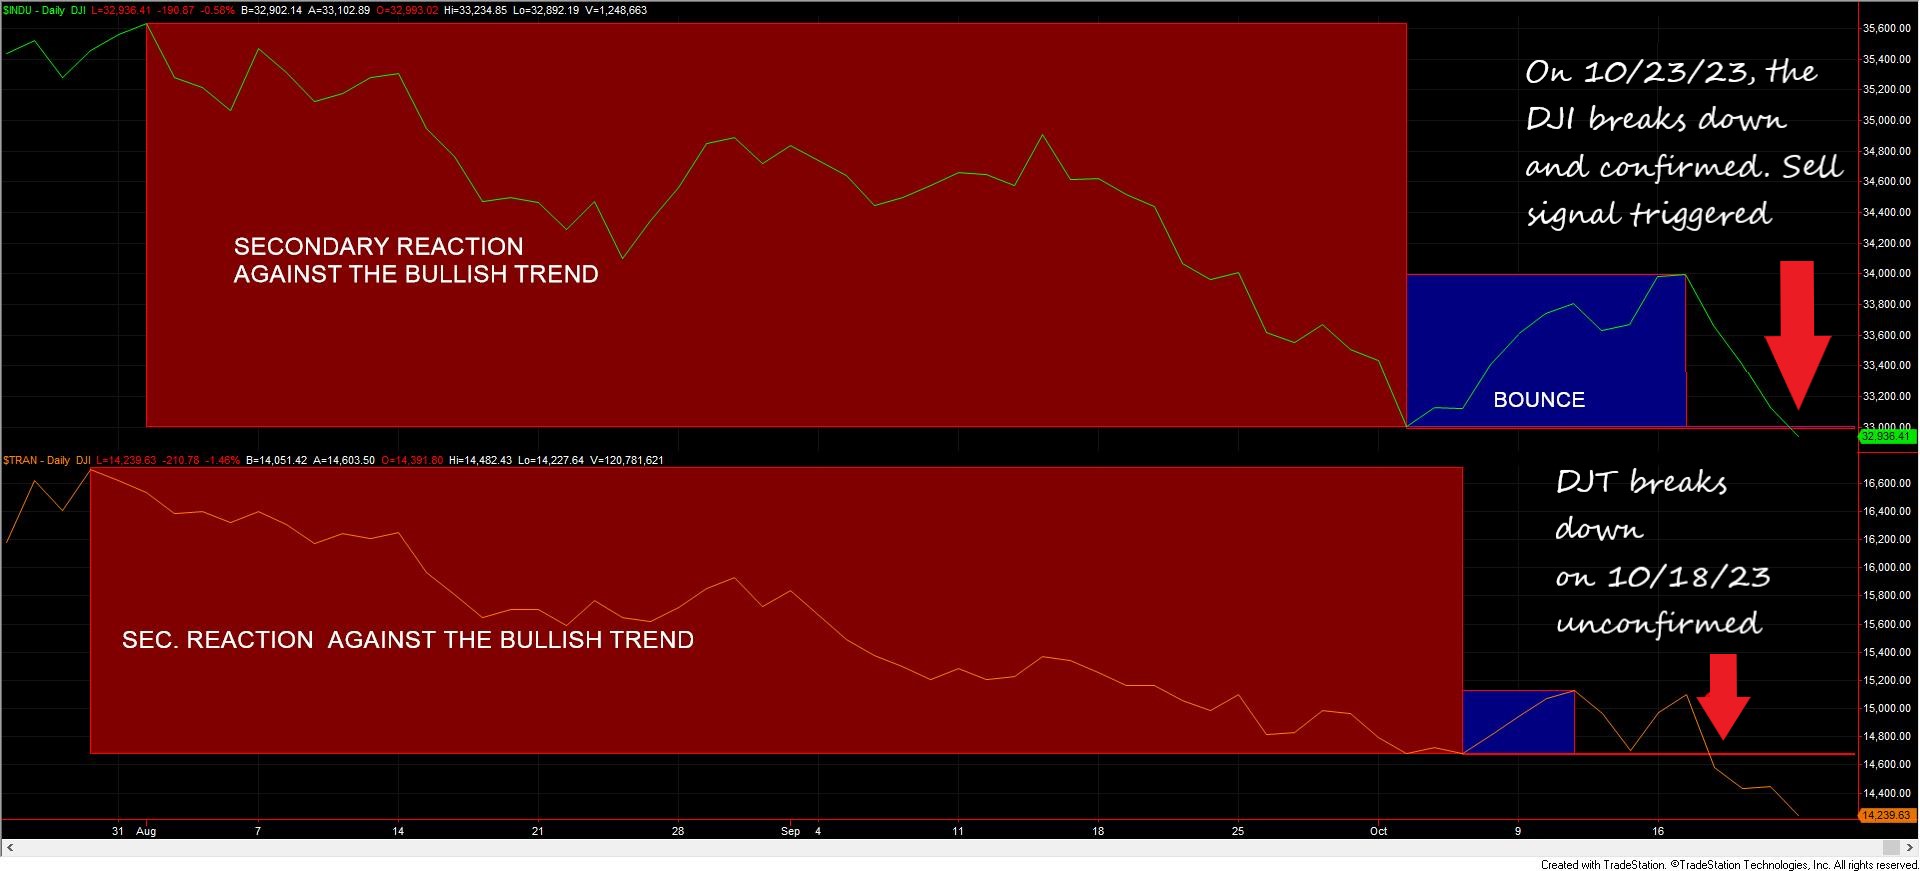
As stated in Matthew’s article, on 10/23/2023, the Dow Industrials broke down below its 10/3/23 closing lows, triggering a SELL signal.
The table below shows the most relevant price action that led to the 10/23/23 Sell signal.

Historical data from 1953 reveals that post a Dow Theory sell signal, the market often experiences an average additional decline of 11.81% before finding its final bottom. For a deeper dive, you can explore the details in the link given below.
https://thedowtheory.com/resources/traditional-dow-theory/declines-after-selling/
This SELL signal points towards the potential for further downside in the market’s price action.
As an aside, our own Dow Theory variation, the Dow Theory for the 21st Century, (DT21C) triggered a SELL on 10/20/23, which allowed us and our Subscribers to exit at a slightly better price. The DT21C is even better (more outperformance and drawdown reduction vs. Buy & Hold) than the classical Dow Theory, as I explained here.
The chart below shows the most recent price action. The orange rectangles display the secondary reaction against the bull market. The blue rectangles highlight the bounce that completed the setup for a Sell signal. The red horizontal lines showcase the secondary reaction lows (Step #2), which was the relevant price level to be jointly violated for a Sell signal to be given.

Sincerely,
Manuel Blay
Editor of thedowtheory.com


