Overview: The easing of geopolitical tensions, a preliminary truce in the tariff wars, and some forced liquidations have pushed GDX and SIL into a new bear market. In contrast, gold and silver have remained more resilient and continue to trade within a primary bull market.
General Remarks:
In this post, I extensively elaborate on the rationale behind employing two alternative definitions to evaluate secondary reactions.
SIL refers to the Silver Miners ETF. More information about SIL can be found HERE.
GDX refers to the Gold Miners ETF. More information about GDX can be found HERE.
A) Market situation if one appraises secondary reactions not bound by the three weeks and 1/3 retracement dogma.
As I explained in this post, the primary trend was signaled bullish on 3/13/25.
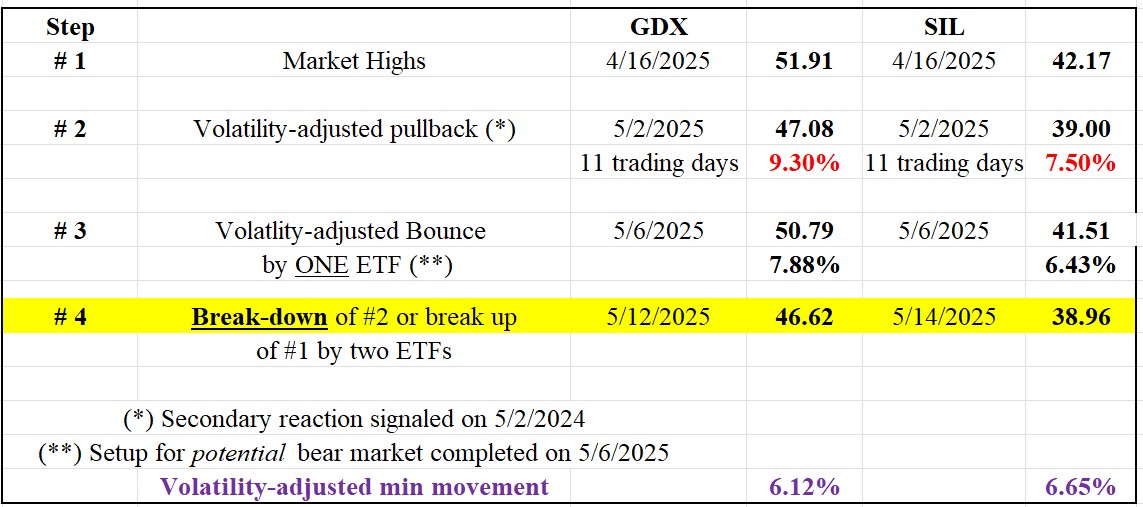
Following the 4/16/25 closing highs (Step #1 in the table below), GDX and SIL dropped for 11 trading days (Step #2). The time requirement for a secondary reaction was met. The pullback exceeded the Volatility-Adjusted Minimum Movement (VAMM), so the extent requirement was also fulfilled. More about the VAMM HERE.
A rally followed (Step #3) that was >=2 days on both ETFs, with GDX exceeding its VAMM. Please remember that we don’t require confirmation for the final rally that completes a bear (or bull) signal setup. More information is in this post.
On 5/14/25 (Step #3), GDX and SIL jointly pierced their respective secondary reaction lows, as shown in Step #2 in the table below. Such a confirmed breakdown shifted the trend from bullish to bearish.

So, the primary and secondary trends are bearish now.
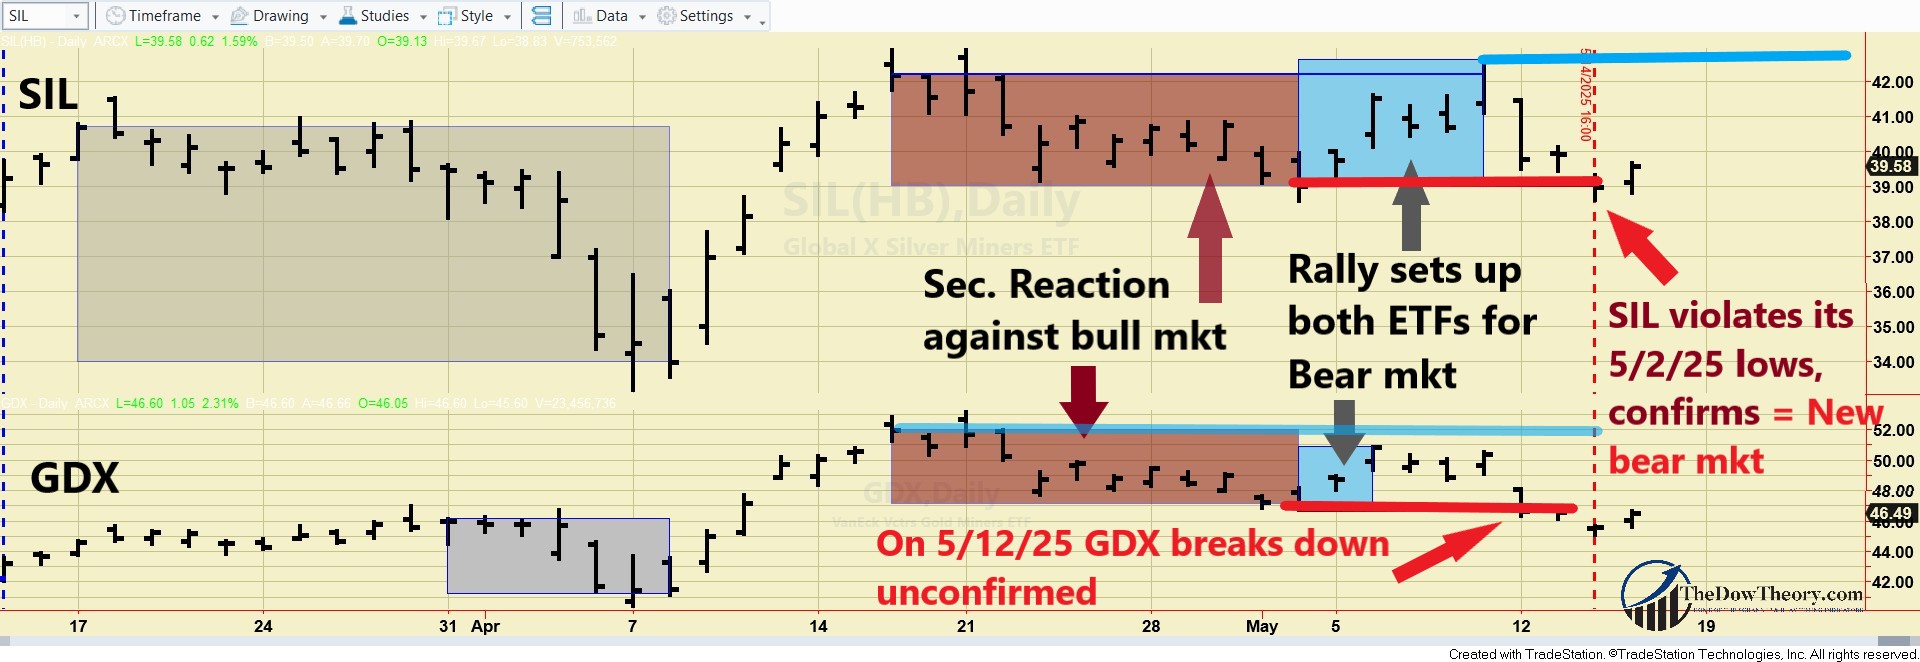
The following charts depict the latest price movements. Brown rectangles indicate the secondary (bearish) reaction opposing the ongoing primary bull market. Blue rectangles highlight the recent rally that fulfilled the setup for a potential primary bear market (Step #3). Red horizontal lines mark the secondary reaction lows (Step #2). The blue horizontal lines show the bull market highs. A breach of these peaks would signal a new primary bull market, though this scenario appears unlikely in the near term. The grey rectangles highlight a pullback that did not meet the time requirement for a secondary reaction, and hence was ignored.

So, the situation is as follows: At the current juncture, a breakup on a closing basis by GDX of the 4/16/25 closing highs and by SIL of the 5/9/25 closing highs would signal a new bull market. Until this breakup occurs, we consider GDX and SIL in a bear market.B) Market situation if one sticks to the traditional interpretation demanding more than three weeks and 1/3 confirmed retracement to declare a secondary reaction.
As I explained in this post, the primary trend was signaled bullish on 3/13/25.
The current drop has not reached at least 15 trading days on both ETFs, so there is no secondary reaction.
Therefore, the primary and secondary trends remain bullish.
Sincerely,
Manuel Blay
Editor of thedowtheory.com


