Overview:
On April 4, 2025, following a strong rally driven by lower interest rates, the Dow Theory signaled the start of a new bull market in U.S. bonds. The key question now: What is the market anticipating? Is it pricing in lower inflation amid a soft landing—or something more concerning, like a recession-induced drop in inflation?
As a reminder, the 3-month/10-year yield curve is inverted. While not a definitive predictor, an inverted yield curve has historically served as a reliable warning sign of upcoming recessions.
General Remarks:
In this post, I extensively elaborate on the rationale behind employing two alternative definitions to evaluate secondary reactions.
TLT refers to the iShares 20+ Year Treasury Bond ETF. You can find more information about it here
IEF refers to the iShares 7-10 Year Treasury Bond ETF. You can find more information about it here.
TLT tracks longer-term US bonds, while IEF tracks intermediate-term US bonds. A bull market in bonds signifies lower interest rates, whereas a bear market in bonds indicates higher interest rates.
A) Market situation if one appraises secondary reactions not bound by the three weeks and 1/3 retracement dogma
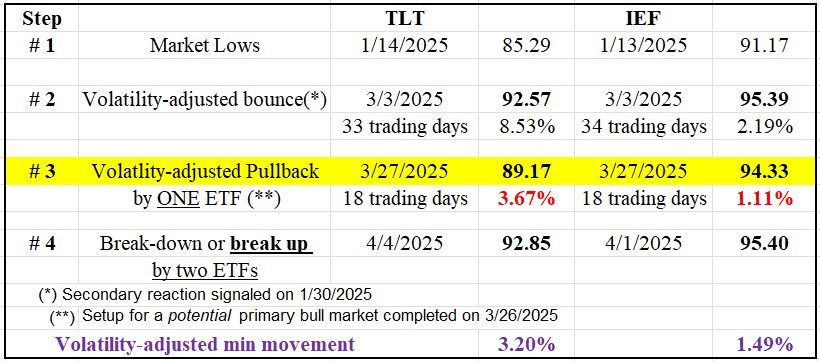
The primary trend shifted to bullish on 4/4/25 when TLT surpassed its 3/3/25 closing high, and confirmed IEF which had broken up on 4/1/25.
You may read more about the setup that preceded the new primary bull market signal in my 3/26/25 post.
The table below displays the price action that led to the new bull market signal.

So, now the primary and secondary trends are bullish.
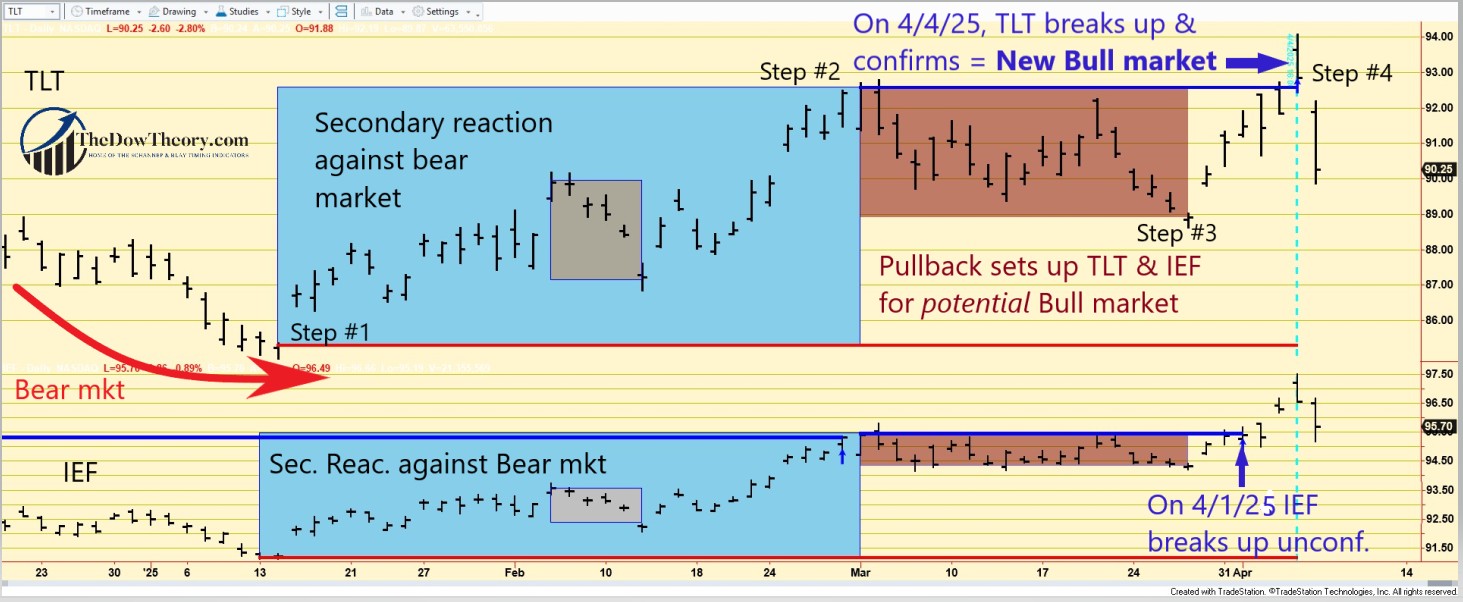
The charts below depict the current market situation. The grey rectangles on the left show a drop that occurred in February that did not have enough extent to set up TLT and IEF for a potential bull market signal. The blue rectangles (Step #2) highlight the current secondary (bullish) reaction against the primary bear market. The brown rectangles show the most recent pullback that set up both ETFs for a potential primary bull market signal. The blue horizontal lines highlight the bounce highs (step #2), whose breakup signaled the new bull market. The red horizontal lines highlight the Bear market lows (Step #3) whose breakdown would signal a new primary bear market.

B) Market situation if one sticks to the traditional interpretation demanding more than three weeks and 1/3 confirmed retracement to declare a secondary reaction.
In this instance, the trend assessment using the “long-term” Dow Theory aligns with the “short-term” version. Therefore, my earlier explanation is applicable here. The primary trend is now bullish, as well as the secondary one.
Sincerely,
Manuel Blay
Editor of thedowtheory.com


