“Rhea’s /classical” Dow Theory
Depending on the way one appraised the secondary reaction following the 3/23/2020 bear market bottom, the primary trend was signaled as bullish, either on 4/29/20 or 5/26/2020. Please check the links to fully apprehend the two alternative ways:
http://www.dowtheoryinvestment.com/2020/05/dow-theory-update-for-may-15th.html
http://www.dowtheoryinvestment.com/2020/06/dow-theory-update-for-june-3-us-stocks.html
On 11/02/2021, the Dow Transportation confirmed the Industrials in making higher highs and, accordingly, the primary bull market was reaffirmed, as was explained here.
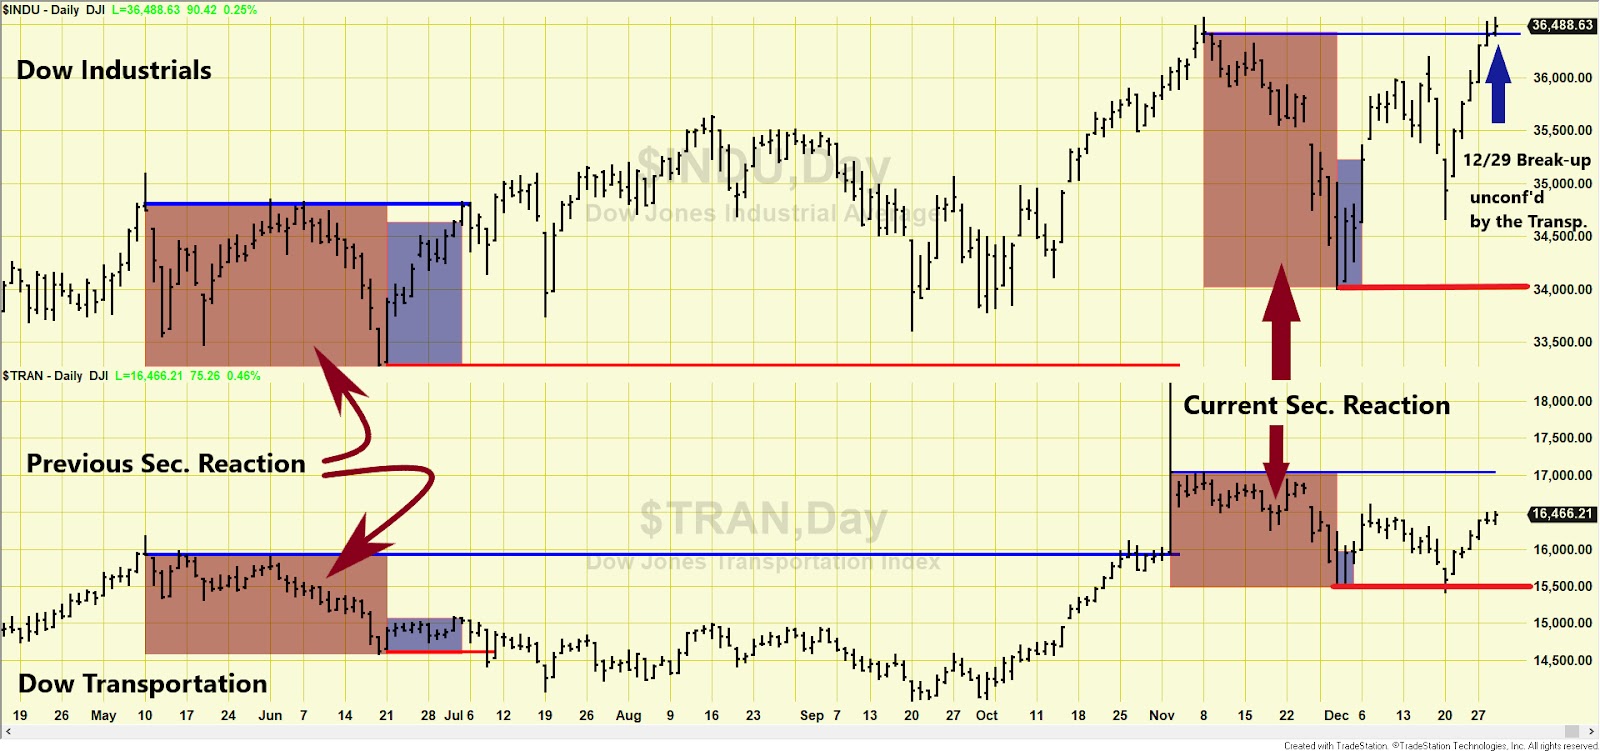
Following their respective 11/8/21 and 11/2/21 closing highs (Step #1), the Dow Industrials and Transportation declined until 12/1/21. The pullback satisfied both the time (at least 15 confirmed trading days) and extent (3% or more confirmed decline) requirement for a secondary reaction (Step #2). Off the 12/1/21 lows, the Dow Transportation rallied by at least 3% on 12/3/21, and the Dow Industrials on 12/6/21. Given that the both Indexes rallied 2 days or more, the setup for a potential Sell signal was completed on 12/6/21. On 12/29/2021, the Dow Industrials broke topside their 11/8/2021 closing highs unconfirmed by the Dow Transportation. Accordingly, the primary bull market has not been reconfirmed, and the secondary reaction has not been terminated.
So the current situation is as follows:
a) Either the Dow Transportation breaks topside its 11/2/21 market highs (Step #1), in which case the Bull market would be reaffirmed and the secondary reaction terminated
b) Or both Dow Industrials and Transportation break downside their secondary reaction lows (Step #2) in which case a Sell signal would be given.
The table below contains all the relevant data:
Below are the updated charts that display the previous secondary reaction (brownish rectangles on the left) successfully terminated, and the current (brownish rectangles on the right). The purple rectangles show the rally that follows the secondary reaction lows once it reaches the minimum of two confirmed trading days and at least one index moving 3% or more (setup for a potential primary bear market signal). The blue arrow on the right side of the top chart shows the Dow Industrials break-up unconfirmed by the Dow Transportation.
Andwhat about the trend when appraised by the Dow Theory for the 21stCentury (aka. Schannep’s Dow Theory)? As an appetizer, Schannep’s Dow Theory since 1953 outperformed Buy and Hold by 3.25% p.a. with a marked reduction of both the depth and time in drawdown. Schannep’s Dow Theory achieved such an outperformance by investing only in the major indexes, which is quite a feat. Furthermore, we went 100% invested on 4/6/2020 and have ridden the Bull to this date. On the other hand, the “original/classical” Dow Theory outperformed Buy and Hold by a modest 0.41% p.a., which is also OK given that drawdowns were also reduced. On a risked-adjusted basis, both Dow Theory “flavors” greatly outperformed Buy and Hold. Do you want to know more? Become a Subscriber, and you’ll get access to a wealth of information (i.e., access to our Letters since 1962 and their concomitant trade recommendations, the power of the consumer confidence report as a timing device, the special report about the yield curve, how to calculate profit objectives that work, and much more). More importantly, you’ll be punctually updated through our email service of any change of trends. Not accidentally, our Newsletter has consistently been ranked among the top investments Letters.
Sincerely,
Manuel Blay
Co-Editor of thedowtheory.com


