Gold and silver up
Let’s get started with our Dow Theory commentary in this blog today.
Special note on gold
GLD lost last Friday (Feb 22) almost 10 tonnes of gold. Thus, inventories have been declining for 4 days in a row. All in all, inventories have declined from 1322.97 tons to 1280.67 tonnes, that is 3.3%. Only higher gold prices can stop the bleeding (higher prices would result, hopefully, in investors demanding less physical gold). If you want to know why this, contrary to conventional wisdom, is bullish for gold, you are advised to go hereand especially, here (Victor the Cleaner’s blog)
You can monitor yourself GLD inventories by going here.
Stocks
The SPY, Industrials and Transports closed down. Even though I “feel” we are entering into a secondary reaction according to the Dow Theory (in any “flavor” you choose), it is too early to label in “real time” the secondary trend as bearish. As per the Dow Theory, we need to see at least two indices declining by more than 3% and such decline should last at the very least 10 trading days. Until now, none of these requirements has been met yet. I have to wait to subsequent market action to label the secondary trend as bearish.
Thus, I can only say that the primary and secondary trend remains bullish.
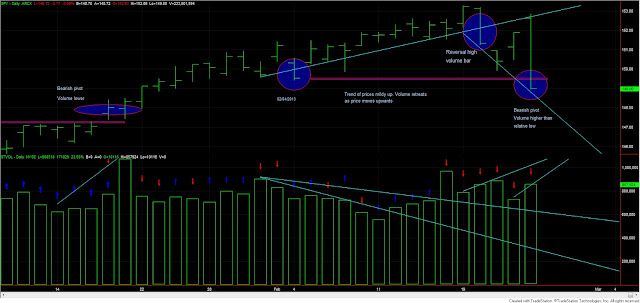
Volume was bearish, once again, for a sixth day in a row. Today we saw a monster reversal bar whose volume was larger than Friday’s.
Furthermore, today’s volume was significantly higher than the volume saw at the last pivot low made on 02/04/2013. Look at the pink line connecting the 02/04/2013 low with today’s low. Higher volume at pivot points (as we had today) with bearish price action (as we had today) denote weakness. This is why I included two red arrows to today’s volume action. One red arrow for the ordinary bearish volume day; another one for the bearish pivot volume.
 |
| Volume suggests the odds for a secondary reaction are increasing |
So currently volume is bearish short term, hinting at the development of a secondary reaction, since:
1. We have had six bearish days in a row, which means volume expands when prices decline and volume retreats when prices advance.
2. Don’t forget the “volume of the top” reversal bar of 02/20/2013. More about it here.
3. The trend line of volume was not supportive of the last stage of the rally and, conversely, it has been supportive of declining prices (upward trend line of volume with downward trend line of volume).
4. Today’s volume was significantly larger than that saw on 02/04/2013 (last minor low). It denotes that the mood of the market has changed. More people were eager to sell their stocks today than on February 4. This is bearish. If you are interested in knowing more about volume and pivots, I advise you to read L.A.Little’s outstanding work in this subject.
However, the following caveats come to my mind:
1. Volume readings merely increase the odds of something happening (i.e. development of a secondary reaction). However, trends and secondary reaction are made by price action not by volume. Volume merely qualifies the trend.
2. Excessive volume bearishness tends to beget a short-lived counter movement (i.e. a minor rally). However, I fear this is precisely what we saw last Friday. Last Thursday 02/21/2013 volume was already very bearish and hence I wrote that a short rally (1-3 days) was likely to occur. The fact that the rally started on Friday has fizzled out today is certainly a very bad omen.
3. All these musings concerning volume are of barely any interest for investors along the primary trend. However, I am of the opinion that there is a golden rule of markets that rewards the knowledgeable and punishes the unprepared. So, even if I am more concerned with the primary trend, I feel the more I understand markets (and volume), the better. Furthermore, investing is so trying that the more I understand the intricacies of the ongoing trend, the less prone I will be to panic when the going gets tough (as it will inevitably happen sooner or later). Knowledge is power.
By the way, “TheReformed Broker” blog has also noticed that “distribution” days are piling up. Distribution day, according to Investopedia, is a down (or an unchanged) day on increasing volume.
Gold and Silver
GLD and SLV closed up for a third day in a row. As per Dow Theory, it is much too early to detect any change in trend. Thus, the primary and secondary trend remains bearish.
The gold and silver miners ETF closed up. The primary and secondary trend remains bearish.
Here you have the figures of the markets I monitor for today:
| Data for February 25, 2013 | |||
| DOW THEORY PRIMARY TREND MONITOR SPY | |||
| SPY | |||
| Bull market started | 11/15/2012 | 135.7 | |
| Bull market signaled | 01/02/2013 | 146.1 | |
| Last close | 02/25/2013 | 149 | |
| Current stop level: Bear mkt low | 135.7 | ||
| Unrlzd gain % | Tot advance since start bull mkt | Max Pot Loss % | |
| 2.01% | 9.80% | 7.63% | |
| DOW THEORY PRIMARY TREND MONITOR GOLD (GLD) | |||
| GLD | |||
| Bull market started | 05/16/2012 | 149.5 | |
| Bull market signaled | 08/22/2012 | 160.5 | |
| Exit December 20 | 12/20/2012 | 161.2 | |
| Current stop level: Sec React low | 11/02/2012 | 162.6 | |
| Realized Loss % | Tot advance since start bull mkt | ||
| 0.39% | 7.83% | ||
| DOW THEORY PRIMARY TREND MONITOR SILVER (SLV) | |||
| SLV | |||
| Bull market started | 06/28/2012 | 25.63 | |
| Bull market signaled | 08/22/2012 | 28.92 | |
| Exit December 20 | 12/20/2012 | 29 | |
| Current stop level: Sec React low | 11/02/2012 | 29.95 | |
| Realized gain % | Tot advance since start bull mkt | ||
| 0.28% | 13.15% | ||
| DOW THEORY PRIMARY TREND MONITOR ETF SIL | |||
| SIL | |||
| Bull market started | 07/24/2012 | 17.08 | |
| Bull market signaled | 09/04/2012 | 21.83 | |
| Exit January 23 | 01/24/2013 | 21.69 | |
| Current stop level: Sec React low | 11/15/2012 | 21.87 | |
| Realized Loss % | Tot advance since start bull mkt | Max Pot Loss % | |
| -0.64% | 26.99% | 27.81% | |
| DOW THEORY PRIMARY TREND MONITOR ETF GDX | |||
| GDX | |||
| Bull market started | 05/16/2012 | 39.56 | |
| Bull market signaled | 09/04/2012 | 47.77 | |
| Exit January 23 | 01/24/2013 | 44.56 | |
| Current stop level: Sec React low | 12/05/2012 | 45.35 | |
| Realized Loss % | Tot advance since start bull mkt | Max Pot Loss % | |
| -6.72% | 12.64% | 20.75% | |
Sincerely,
The Dow Theorist


