Gold and silver slightly down
Let’s analyze the markets under the prism of the Dow Theory.
The SPY, Industrials and Transports closed up. The Transports have bettered its 01/04/2013 highs. However, neither the SPY nor the Industrials have confirmed.
The primary trend and secondary trend for stocks is bullish.
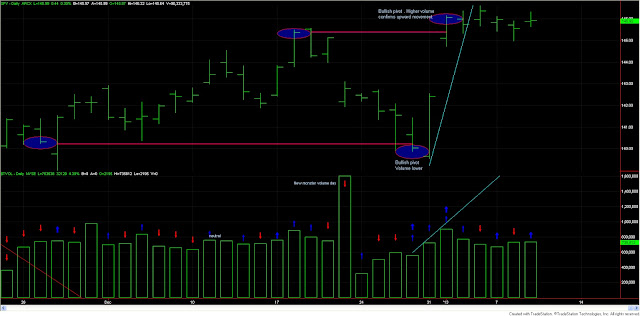
Volume today was slightly higher than yesterday’s. Since it was an “up” day, upward action was confirmed by volume, and hence it has a bullish connotation. As you can see in the chart below the number of blue (bullish) and red (bearish) arrows is quite similar. From such a standpoint, I’d label volume as neutral.
 |
| Volume seems to be supporting the new trend |
However, I see two distinct bullish volume formations in the chart.
Firstly, as I wrote on January7 “we see that the last rally off the lows was supported by volume (volume expanding with price) whereas volume is contracting during the incipient consolidations we are currently seeing. I’d label this action as bullish.” Thus, please notice the blue trend lines.
Secondly, as you know, I tend to pay attention to volume action at significant pivots. I see that the last two significant pivots have a bullish volume implication. Thus, volume at the 12/28/2012 lows was lower than volume at the preceding pivot low of 11/27/2012. Please mind the pink line connecting both lows so that you can spot them more easily. Lower volume at comparable price (pivot) levels implies that as such prices, there was not strong conviction. Conversely, the 01/02/2013 highs (which, by the way, coincide with the signaling of a primary bull market) witnessed higher volume than the preceding pivot high of 12/18/2012 which validates the upward movement. All in all, volume at the last pivot low was bullish (contracting volume) and volume at the last pivot high was bullish too (expanding volume).
So my overall assessment of volume is bullish.
The only thing that bothers me is the monster volume down day we saw on 12/21/2012. Normally, such monster volume days leave scars on the charts. The most obvious interpretation of such a day is that its range was resistance to further advance. Such resistance was clearly broken out, so now that day’s range should act as support for prices should they decline.
Please bear in mind that volume is clearly of secondary importance, and trends are made by price action not by volume. Volume merely serves to qualify the trend and helps us make an assessment as to whether the price trend is likely to continue (confirming volume) or not.
Gold and silver closed slightly down. The primary and secondary trend remains bearish.
SIL and GDX (the silver and gold miners ETF) closed up and down respectively. The primary trend remains bullish, and the secondary trend remains bearish.
Here you have the figures of the markets I monitor for today:
| Data for January 9, 2013 | |||
| DOW THEORY PRIMARY TREND MONITOR SPY | |||
| SPY | |||
| Bull market started | 11/15/2012 | 135.7 | |
| Bull market signaled | 01/02/2013 | 146.1 | |
| Last close | 01/09/2013 | 145.9 | |
| Current stop level: Bear mkt low | 135.7 | ||
| Unrlzd gain % | Tot advance since start bull mkt | Max Pot Loss % | |
| -0.10% | 7.53% | 7.63% | |
| DOW THEORY PRIMARY TREND MONITOR GOLD (GLD) | |||
| GLD | |||
| Bull market started | 05/16/2012 | 149.5 | |
| Bull market signaled | 08/22/2012 | 160.5 | |
| Exit December 20 | 12/20/2012 | 161.2 | |
| Current stop level: Sec React low | 11/02/2012 | 162.6 | |
| Realized Loss % | Tot advance since start bull mkt | ||
| 0.39% | 7.83% | ||
| DOW THEORY PRIMARY TREND MONITOR SILVER (SLV) | |||
| SLV | |||
| Bull market started | 06/28/2012 | 25.63 | |
| Bull market signaled | 08/22/2012 | 28.92 | |
| Exit December 20 | 12/20/2012 | 29 | |
| Current stop level: Sec React low | 11/02/2012 | 29.95 | |
| Realized gain % | Tot advance since start bull mkt | ||
| 0.28% | 13.15% | ||
| DOW THEORY PRIMARY TREND MONITOR ETF SIL | |||
| SIL | |||
| Bull market started | 07/24/2012 | 17.08 | |
| Bull market signaled | 09/04/2012 | 21.83 | |
| Last close | 01/09/2013 | 22.12 | |
| Current stop level: Bear mkt low | 17.08 | ||
| Unrlzd gain % | Tot advance since start bull mkt | Max Pot Loss % | |
| 1.33% | 29.51% | 27.81% | |
| DOW THEORY PRIMARY TREND MONITOR ETF GDX | |||
| GDX | |||
| Bull market started | 05/16/2012 | 39.56 | |
| Bull market signaled | 09/04/2012 | 47.77 | |
| Last close | 01/09/2013 | 44.36 | |
| Current stop level: Bear mkt low | 39.56 | ||
| Unrlzd gain % | Tot advance since start bull mkt | Max Pot Loss % | |
| -7.14% | 12.13% | 20.75% | |
Sincerely,
The Dow Theorist.


