Stocks close down, and Transports fail to confirm
Formidable article on Maulding Economics concerning what is really happening to gold
I give you the link without further ado:
If you are serious about understanding current developments, you are encouraged to read it.
However, as with any “fundamental” opinion, so should put it into a “secular” context, as explained in my post “Secular trend versus long term trend”
Stocks
The SPY, Industrials, and Transports closed down.
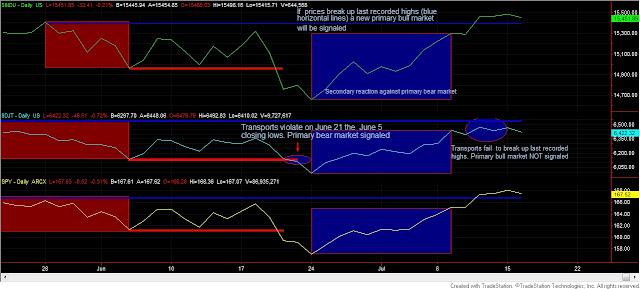
As you can see from the chart below, the Transports have not bettered the last recorded highs (blue horizontal line) yet, and, accordingly, as explained here, no primary bull market has been signaled. The ellipse highlights the lack of confirmation.
 |
| Transports (middle) refuse to confirm Industrials (top) and SPY (bottom) higher closing highs. The longer the non-confirmation persist, the higher the odds of a trend reversal |
The secondary trend is bullish, as has been explained here.
Today’s volume was higher than yesterday’s, which is bearish as lower prices were joined by increasing volume. Yesterday was a bearish volume day too, as advancing prices saw retreating volume. Furthermore, I read on Zero Hedge that yesterday was the lowest volume day of the year.
The overall pattern of volume is bearish, for the reasons given here.
Gold and Silver
SLV and GLD closed up. Gold bettered the its 07/11 closing high. SLV failed to confirm. The primary trend is bearish, as explained here and reconfirmed bearish here. The secondary trend remains bearish too.
GDX and SIL, the gold and silver miners ETFs closed up. Furthermore, both ETFs bettered their 07/11 closing highs, which further confirms the ongoing secondary reaction. However, it is no time for fireworks yet. We won’t get some glimpse of hope until the primary trend turns bullish. The primary trend is bearish, as explained here and reconfirmed bearish here.
The secondary trend for GDX and SIL is bullish, as explained here.
Here you have an updated chart of both ETFs, which clearly shows the secondary trend (blue rectangles):
 |
| Secondary reaction against the primary bearish trend seems to consolidate |
Here you have the figures of the markets I monitor for today, which contain no changes, as we are flat.
| Data for July 16, 2013 | |||
| DOW THEORY PRIMARY TREND MONITOR SPY | |||
| SPY | |||
| Bull market started | 11/15/2012 | 135.7 | |
| Bull market signaled | 01/02/2013 | 146.06 | |
| Exit June 21 | 06/21/2013 | 159.07 | |
| Current stop level: Sec reaction lows | 161.27 | ||
| Realized gain % | Tot advance since start bull mkt | Max Pot Loss % | |
| 8.91% | 17.22% | None. | |
| DOW THEORY PRIMARY TREND MONITOR GOLD (GLD) | |||
| GLD | |||
| Bull market started | 05/16/2012 | 149.46 | |
| Bull market signaled | 08/22/2012 | 160.54 | |
| Exit December 20 | 12/20/2012 | 161.16 | |
| Current stop level: Sec React low | 11/02/2012 | 162.6 | |
| Realized Loss % | Tot advance since start bull mkt | ||
| 0.39% | 7.83% | ||
| DOW THEORY PRIMARY TREND MONITOR SILVER (SLV) | |||
| SLV | |||
| Bull market started | 06/28/2012 | 25.63 | |
| Bull market signaled | 08/22/2012 | 28.92 | |
| Exit December 20 | 12/20/2012 | 29 | |
| Current stop level: Sec React low | 11/02/2012 | 29.95 | |
| Realized gain % | Tot advance since start bull mkt | ||
| 0.28% | 13.15% | ||
| DOW THEORY PRIMARY TREND MONITOR ETF SIL | |||
| SIL | |||
| Bull market started | 07/24/2012 | 17.08 | |
| Bull market signaled | 09/04/2012 | 21.83 | |
| Exit January 23 | 01/24/2013 | 21.69 | |
| Current stop level: Sec React low | 11/15/2012 | 21.87 | |
| Realized Loss % | Tot advance since start bull mkt | Max Pot Loss % | |
| -0.64% | 26.99% | 27.81% | |
| DOW THEORY PRIMARY TREND MONITOR ETF GDX | |||
| GDX | |||
| Bull market started | 05/16/2012 | 39.56 | |
| Bull market signaled | 09/04/2012 | 47.77 | |
| Exit January 23 | 01/24/2013 | 44.56 | |
| Current stop level: Sec React low | 12/05/2012 | 45.35 | |
| Realized Loss % | Tot advance since start bull mkt | Max Pot Loss % | |
| -6.72% | 12.64% | 20.75% | |
Sincerely,
The Dow Theorist


