General Remarks:
In this post, I thoroughly explained the rationale behind using two alternative definitions to appraise secondary reactions.
GOLD AND SILVER MINERS ETFs (GDX & SIL)
- A) Market situation if one appraises secondary reactions not bound by the three weeks dogma.
The primary trend for GDX and SIL turned bearish on 6/20/23. You may find an in-depth explanation HERE.
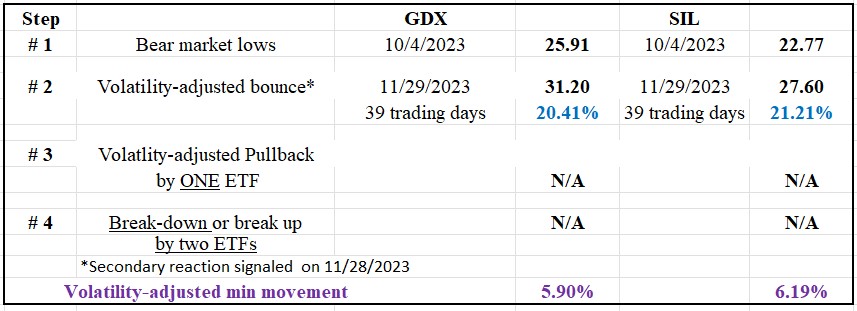
After somerallies fizzled out before qualifying as a secondary reaction, at long last, the rally that started off the 4/10/23 bear market lows finally reached the time and extent requirement for a secondary (bullish) reaction against the primary bear market. The table below contains the relevant dates and prices:

So, now we wait for a >=2 days pullback exceeding the Volatility-Adjusted Minimum Movement (more about the VAMM HERE) on at least one ETF to set up GDX and SIL for a potential primary bull market signal. We don’t require confirmation When dealing with this kind of “setting up” pullback, as I explained in depth HERE.
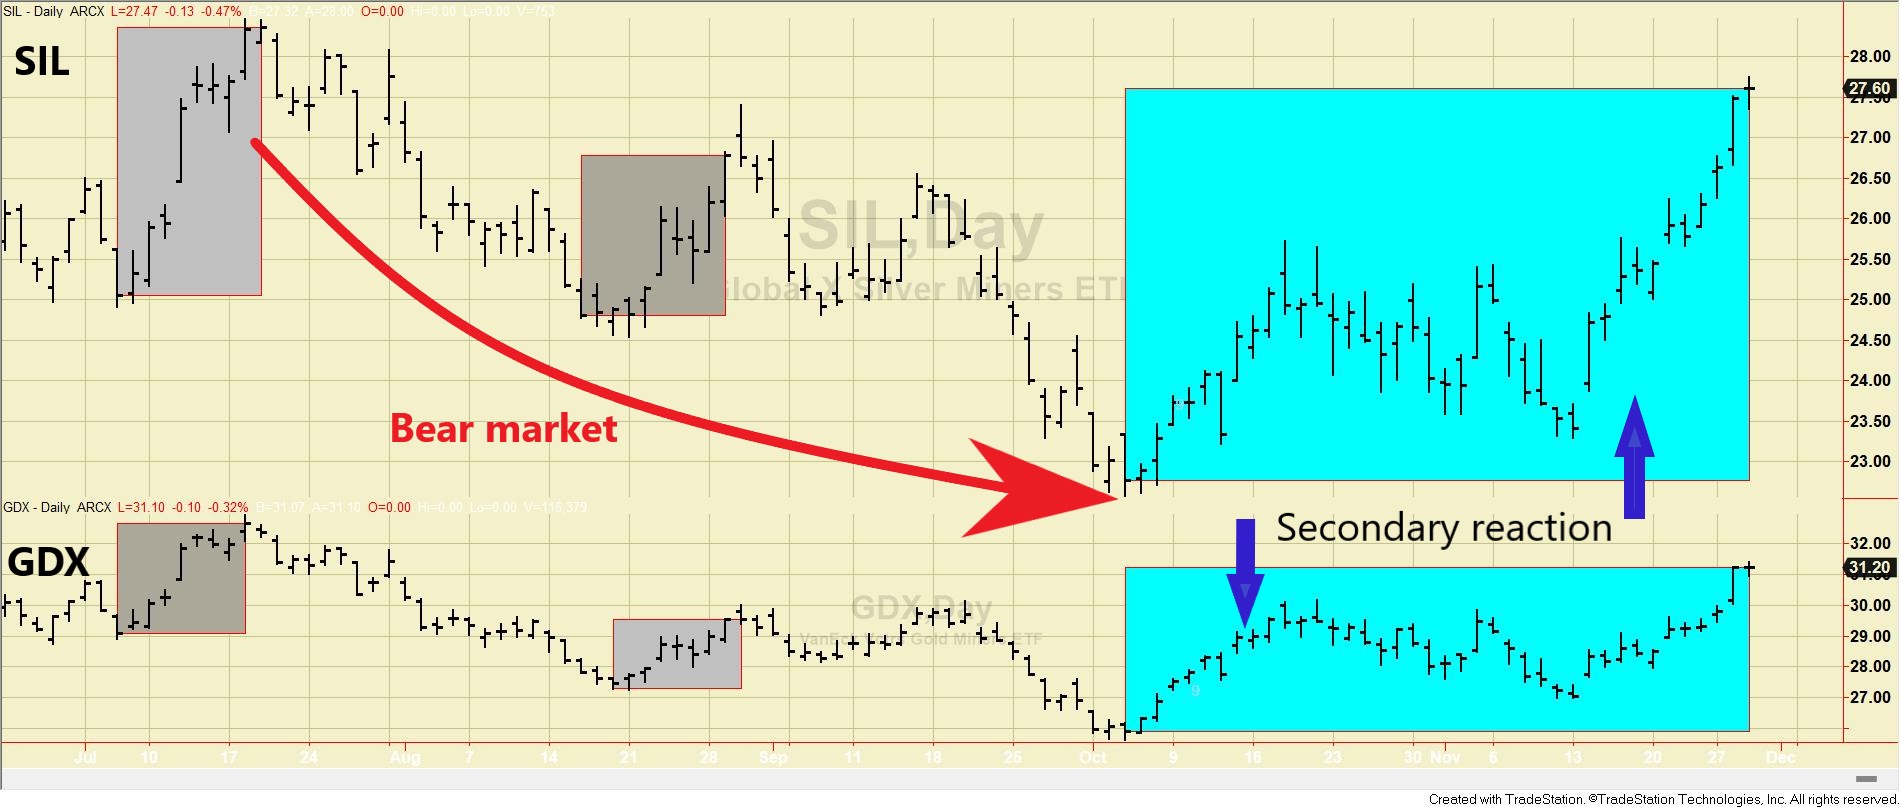
The charts below show the price action that started off the Bear market lows (Step #1), the bounce (secondary reaction against the bear market) that followed (Step #2). The blue horizontal line shows the secondary reaction highs (Step #2), whose confirmed breakup entails a new primary bull market. The blue rectangles highlight the secondary reaction (Step #2)

B) Market situation if one sticks to the traditional interpretation demanding at least three weeks of movement to declare a secondary reaction.
The primary trend was signaled as bearish on 6/20/23, as I explained HERE.
In this specific instance, the trend appraisal using the “long-term” version of the Dow Theory yields the same results as the “short-term” one. So, what I explained above applies fully to this section. The primary trend remains bearish and the secondary one is bullish.
Sincerely,
Manuel Blay
Editor of thedowtheory.com


