Not everything promoted as “Dow Theory” is the correct Dow Theory
Three years ago, I wrote a saga of three posts explaining what I consider “divergent” interpretations of the Dow Theory, namely interpretations that do not fully reflect what true Dow Theorists like Robert Rhea did, and are likely to result in underperformance. More information here, here, and here.
Today, I will refer again to what I consider not only a “divergent” but a plain “heretical” application of the Dow Theory, rendering it useless.
I will not give names, as learning how to properly apply the Dow Theory is what matters.
So what is what I consider to be “heretical” (or “plain wrong”)?
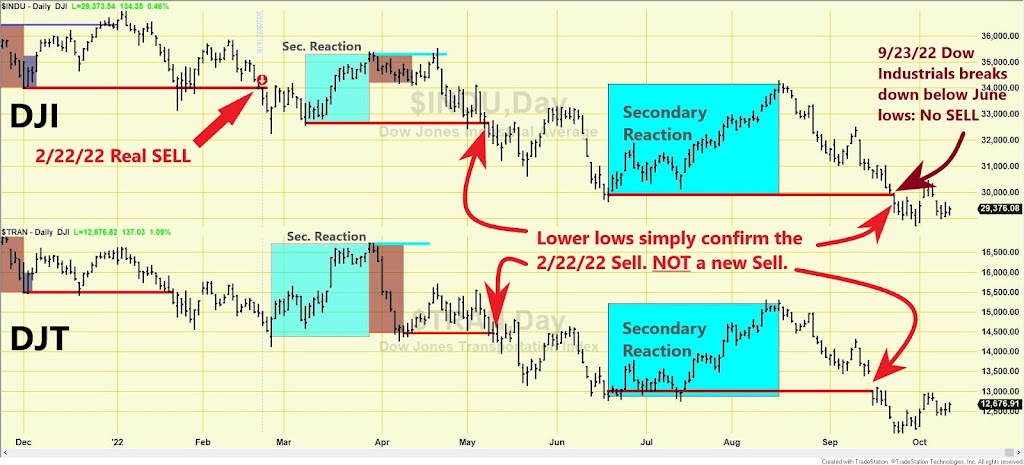
Lower lows by the Dow Industrials and Transportation in September prompted several market observers and journalists to proclaim that “The Dow Theory signals a Sell” because on 9/16/22, the Dow Transportation closed below its June low, and the Dow Industrials on 9/23/22 confirmed.
Those analysts confuse confirmation of an already existing sell signal with a new signal. The differences for investors are enormous.
The “classical” Dow Theory triggered a SELL on 2/22/22, as I explained here.
As the bear market progresses, both Indexes make lower lows. However, the breakdown of prior lows merely confirms the 2/22/22 SELL; it is not a new Sell signal. The longer the bear market lasts and continues making lower lows, the more likely that we are near the end. Of course, we don’t know when it will end, but we do know that the odds for lower prices were much higher on 2/22/22 than on 9/23/22. In other words, acting on a SELL on 9/23/22 implies a realized loss of almost -20% for the Dow Industrials (from the 1/4/22 closing highs), whereas selling at the correct date, 2/22/22 entailed exiting at just of ca. -7.5% off the bull market highs (and locking a realized gain from the previous BUY on 5/26/20 of 34.41%. Timing is everything and getting late to the party may turn a profitable trading system into a money- churning one.
The charts below show the right (and wrong) interpretation of the “classical” Dow Theory
So don’t be misled: The Dow Theory, when properly applied, only triggers one Buy and one Sell. Successive higher highs or lows simply confirm the existing trend (and the last Buy or Sell signal). Of course, writing that the Dow Theory gave a Sell signal on 9/23/22 makes catchier headlines than writing that the bear market or 2/22/22 Sell has been reconfirmed.
And what about the trend when appraised by the Dow Theory for the 21st Century (aka. Schannep’s Dow Theory)? It is also bearish. Schannep’s Dow Theory, since 1953, outperformed Buy and Hold by 3.21% p.a., with a marked reduction of both the depth and time in drawdown. Schannep’s Dow Theory achieved such an outperformance by investing only in the major indexes, which is quite a feat.
Still not enough? We are now targeting 5% p.a. outperformance with our just launched Dow Theory-based ETF trading system, as explained here.
Do you want to know more? Become a Subscriber, and you’ll get access to a wealth of information (i.e., access to our Letters since 1962 and their concomitant trade recommendations, the power of the consumer confidence report as a timing device, the special report about the yield curve, how to calculate profit objectives that work, and much more). More importantly, you’ll be punctually updated through our email service of any change in trends and the specific ETFs making up our Dow Theory on steroids portfolio. Not accidentally, our Newsletter has consistently been ranked among the top investments Letters.
Sincerely,
Manuel Blay
Editor of thedowtheory.com


