Primary and secondary trends remain unchanged
After four trading days of absence, and now with a somewhat less congested schedule, here I am again, ready to analyze the markets under the prism of the Dow Theory.
The last four days did not result in any noteworthy Dow Theory event, which accounted for my silence. Accordingly, neither the primary nor the secondary trend of the markets I monitor changed.
Let’s reacquaint ourselves with the current state of the markets.
US Stocks
The SPY, the Industrials and the Transports closed down.
The secondary trend is also bullish for the reasons explained here, even though if the current pullback extends its decline it could turn soon bearish.
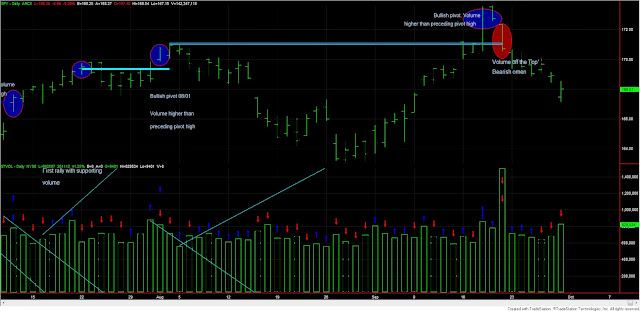
Today’s volume was substantially higher than Friday’s, which is bearish, as lower prices were met by expanding volume. Four trading days have gone by, and I still found the same indecisive pattern: I still see the overall pattern of volume as neutral, as I explained here. However, the bearish “volume off the top” (orange ellipse) bar I spotted here, has resulted in lower prices.
Here you have un updated chart depicting price and volume action:
 |
| Volume still undecisive. “Volume off the top” bar should run its course soon |
Gold and Silver
SLV and GLD closed down. For the reasons I explained here, I feel the primary trend remains bearish. Here I analyzed the primary bear market signal given on December 20, 2012. The primary trend was reconfirmed bearish, as explained here. The secondary trend is bullish (secondary reaction against the primary bearish trend), as explained here.
Here, I explained that GLD and SLV set up for a primary bull market signal. However, a setup is not the same as the “real thing,” namely the primary bull market; thus, many “setups” do not materialize and until the secondary reaction closing highs are jointly broken up, no primary bull market will be signaled.
SIL and GDX closed down. SIL and GDX, unlike GLD and SLV, are unambiguously in a primary bull market under the Dow Theory, as explained here and here.
The secondary trend is bearish, which is tantamount to saying that there is an ongoing secondary reaction against the primary bullish trend, for the reasons given here.
Here you have the figures for the SPY, GDX and SIL which represents the only markets with suggested open long positions.
| Data for September 30, 2013 | |||
| DOW THEORY PRIMARY TREND MONITOR SPY | |||
| SPY | |||
| Bull market started | 06/24/2013 | 157.06 | |
| Bull market signaled | 07/18/2013 | 168.87 | |
| Last close | 09/30/2013 | 168.01 | |
| Current stop level: Secondary reaction low | 163.33 | ||
| Unrlzd gain % | Tot advance since start bull mkt | Max Pot Loss % | |
| -0.51% | 6.97% | 3.39% | |
| DOW THEORY PRIMARY TREND MONITOR ETF SIL | |||
| SIL | |||
| Bull market started | 06/26/2013 | 10.59 | |
| Bull market signaled | 08/14/2013 | 15.36 | |
| Last close | 09/30/2013 | 13.22 | |
| Current stop level: Primary bear mkt low | 06/26/2013 | 10.59 | |
| Unrealized gain % | Tot advance since start bull mkt | Max Pot Loss % | |
| -13.93% | 24.83% | 45.04% | |
| DOW THEORY PRIMARY TREND MONITOR ETF GDX | |||
| GDX | |||
| Bull market started | 06/26/2013 | 22.22 | |
| Bull market signaled | 08/14/2013 | 28.7 | |
| Last close | 09/30/2013 | 25.02 | |
| Current stop level: Primary bear mkt low | 06/26/2013 | 22.22 | |
| Unrealized gain % | Tot advance since start bull mkt | Max Pot Loss % | |
| -12.82% | 12.60% | 29.16% | |
Sincerely,
The Dow Theorist


