Silver Seals the Deal: Bull Market Reconfirmed
Overview: On 6/5/25, silver broke above its 10/22/24 highs. It confirmed gold’s previous breakup on 1/30/25. Accordingly, the primary bull market has been confirmed.
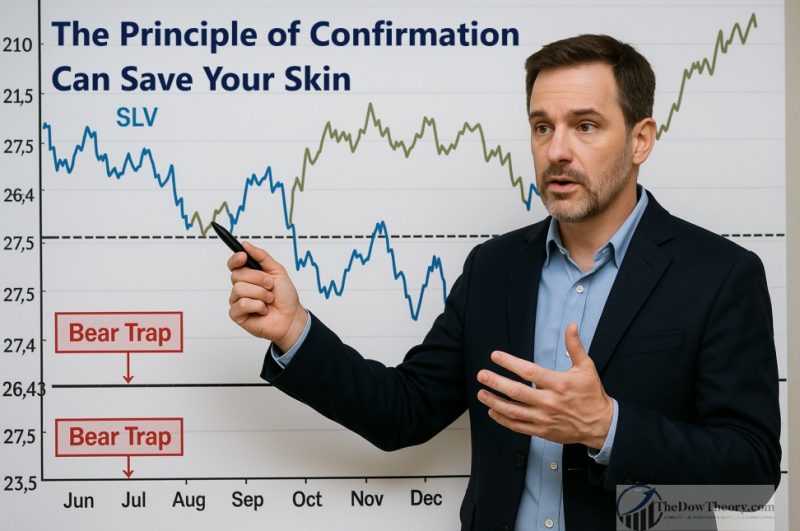
By the way, the recent price action of SLV and GLD offers a powerful reminder of how the principle of confirmation can protect you from costly mistakes. If we had focused on SLV alone, we might have been fooled into thinking a new bear market was underway—it was just a fakeout. This post (and the links within) walks you through several real-world examples showing how confirmation helps filter out false signals and adds real value to your trading decisions.
General Remarks:
In this post, I extensively elaborate on the rationale behind employing two alternative definitions to evaluate secondary reactions.
GLD refers to the SPDR® Gold Shares (NYSEArca: GLD®). More information about GLD can be found HERE.
SLV refers to the iShares SLVver Trust (NYSEArca: SLV®). More information about SLV can be found HERE
A) Market situation if one appraises secondary reactions not bound by the three weeks and 1/3 retracement dogma.
As I explained in this post, the primary trend was signaled as bullish on 4/3/24.
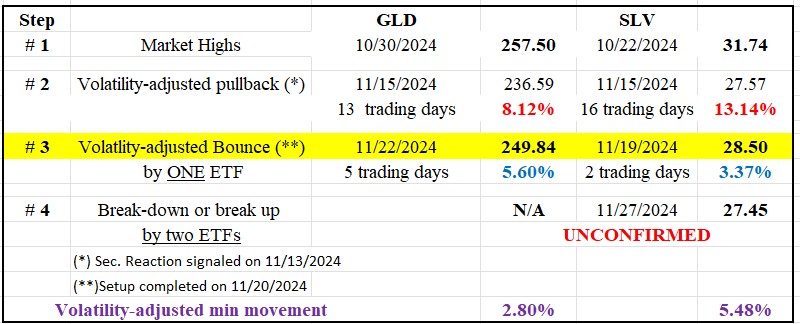
Following the 10/22/24 (SLV) and 10/30/24 (GLD) highs (Step #1 in the table below), there was a pullback until 11/15/24 (Step #2). Such a pullback meets the time and extent requirement for a secondary (bearish) reaction against the still-existing primary bull market. You may find a more in-depth explanation here.
A two-day bounce followed in SLV until 11/19/24, and in GLD until 11/22/24 (Step #3). This bounce met the time (≥2 confirmed days) and extent requirements to set up both precious metals for a potential primary bear market signal.
On 11/27/24, SLV pierced its 11/14/24 lows—unconfirmed by GLD (Step #4). The lack of confirmation meant that no primary bear market was signaled.
The table below displays the price action:

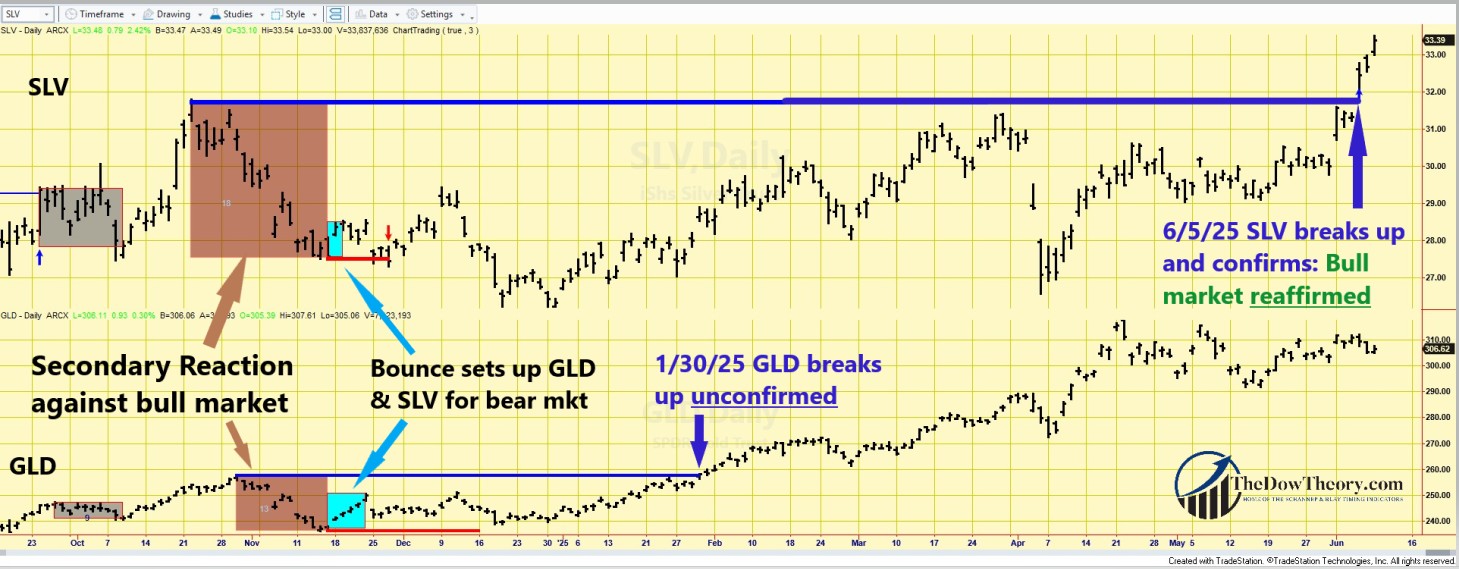
On 1/30/25, GLD surpassed its 10/30/24 highs, unconfirmed by SLV. This lack of confirmation meant that the bull market had not yet been reconfirmed, and the setup for a potential bear market signal remained in force. On 6/5/25, SLV finally surpassed its 10/22/24 highs, confirming GLD’s breakout.
Therefore, the current situation is as follows:
a) The primary bull market has been reconfirmed.
b) The setup for a potential bear market has been canceled.
c) The secondary (bearish) reaction against the bull market has been terminated.
The chart below highlights the price action.
- The brown rectangles show the secondary reaction against the bull market.
- The blue rectangles indicate the bounce that set up GLD and SLV for a potential primary bear market signal.
- The red horizontal lines highlight the secondary reaction lows whose confirmed breakdown would have signaled a new bear market.
- The blue horizontal lines underline the bull market highs, whose breakout confirms the ongoing bull market.

So, the primary and secondary trends are now bullish.
B) Market situation if one sticks to the traditional interpretation demanding more than three weeks and 1/3 confirmed retracement to declare a secondary reaction.
I explained in this post that the primary trend was signaled as bullish on 4/2/24.
The current pullback did not reach 15 confirmed days by both ETFs, so there is no secondary reaction against the bull market.
So, the primary and secondary trends are bullish under the “slower” appraisal of the Dow Theory.
Sincerely,
Manuel Blay
Editor of thedowtheory.com


