“Stocks tend to fluctuate” is a famous quote by J. P. Morgan from the 1930’s, and is a truism for all time. The stock market goes up (a Bull Market) and down (a Bear Market), but beyond that, Wall Street, quite unbelievably, has no universally accepted definition of either. Ned Davis Research defines a Bull Market as “a +13% rise after 155 days”, The Wall Street Journal and others as a +20% rise, again Ned Davis Research as “a +30% gain after 50 days”, and finally Forbes Magazine in “A short history of bull markets” (June 19, 1995) defined “a Bull market as a period in which stocks rise by +300% or more without being interrupted by a correction of 33%”!
So what does constitute a Bull market? My own studies of the stock market in the 20th-21st century show many fluctuations of 10 or 15% that don’t develop into anything beyond that. When stocks as measured by the Dow Jones Industrial Average and the Standard & Poor’s 500 Stock Price Index rise to +19% that is the threshold from which advances have then risen 93.5% of the time to over +29% (only the Bull markets ended on 6/15/1948 & 9/11/1978 did not reach +29%) *. More than half have risen over 75% with the average gain of Bull markets being +106.8% and lasting nearly 3 years based on the record with the aberrations of the 1930’s removed. 100% of those Bull markets in the 20th century have been accompanied by or followed shortly after their start by economic expansions**. Charles Dow originally developed his “Average” over 100 years ago as not only a measure of the stock market’s daily fluctuations, but as a guide to future economic activity, and indeed today the Conference Board uses the S&P500 as one of its components in its Index of Leading Economic Indicators. My definition of a Bull market as a +19% advance is the reciprocal of my definition of a Bear market as a -16% decline (see “Special Report – BEAR Markets in the 20th-21st Centuries” ). Mark Hulbert in a 5/22/18 MarketWatch column concurred with my definition being a better criteria.
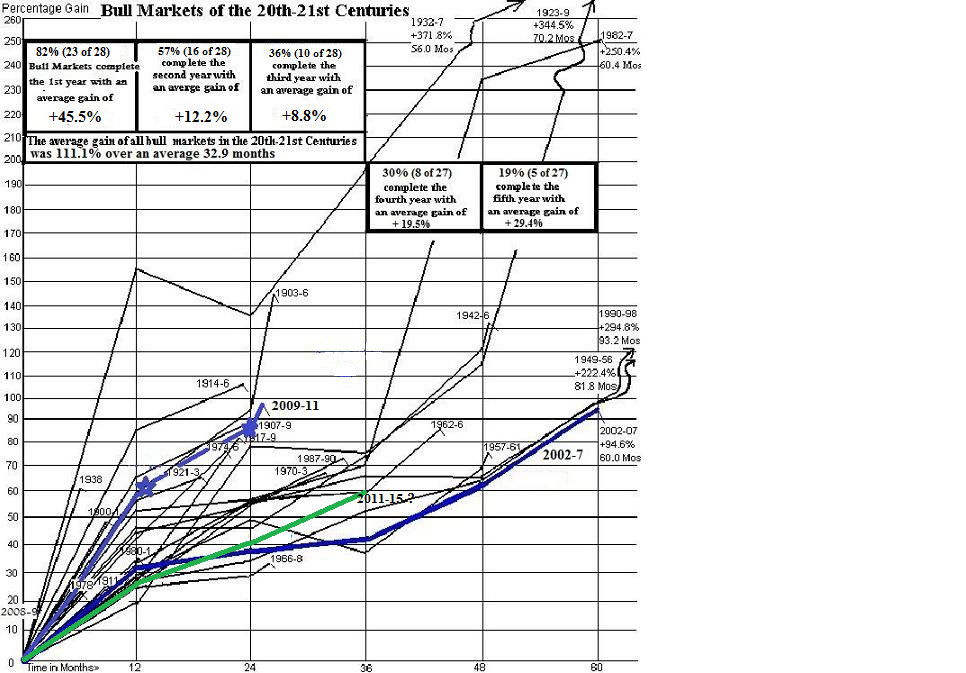
The attached graph shows the 30 Bull markets of the 20th-21st centuries, which are also enumerated in chart form in the Bull & Bear section of our Web site. It is important to identify Bull markets as soon as possible because the 1st year is usually the strongest with the best chance of profitable investment results: an average +46.2% gain with 83.3% of Bull markets lasting into the 2nd year. After that you can see that the gains, while still positive, do drop off as a percentage gain the following 2 years, and indeed, only 33.3% of Bull markets complete the 3rd year. Of those that have completed their 3rd year it is interesting to note that 89% went on to complete their 4th year, after which 67% completed their 5th year. The 2011-2018 Bull market (dark green line) was the shallowest growing of all 30 Bull markets. Other interesting statistics can be gleaned from the Bell Curves shown in the Bull & Bear section under ‘Resources’ on the main page of our Web site.

![]()
* ‘Mini’-Bull markets lasting an average of 3.2 months and rising less than 40 points on average are excluded from this tabulation which eliminates the 10 aberrations of the 1930’s. Details can be found under the ‘Resources’ button on our Web site.
This chart (below) appeared in the Wall Street Journal on September 10th, 2018 and is easier to read than my original “effort” above. It varies, however in two important instances: I show a bone fide Bear market interrupting the 1921-29 Bull market in 1923 (confirmed in the WSJ on 11-21-1929 “There was a genuine major bear market in 1923, but it lasted only eight months”). In 2011 another short but real Bear market interrupted the 2009-18 Bull market, therefore those are NOT the longest Bull markets despite being shown as such. I have inserted the corrections in BLUE. The 1990- 98 Bull market lasted 93.2 months and is the longest (the 2011-18 Bull market ended in October exactly 84 months old and was the second longest).
 ** “The Stock Market as a Business Cycle ‘Predictor’ in the 20th-21st Century” can also be found in the Bull & Bear section under ‘Resources’ on our Web site.
BULL MARKET GAINS, 1st YR, 2nd, ETC:
| Bear Low | Level | 1 yr later | % gain | 2 yrs later | % gain | 3 yrs later | % gain | 4 yrs later | % gain | 5 yrs later | % gain |
|---|---|---|---|---|---|---|---|---|---|---|---|
| 9/24/1900 | 52.96 | n/a (topped 6/17/01 @ 78.26 +47.8% for that partial year) | |||||||||
| 11/9/1903 | 42.15 | 67.07 | 59.1% | 81.56 | 21.6% | n/a | |||||
| 11/15/1907 | 53.00 | 88.09 | 66.2% | 99.31 | 12.7% | n/a | |||||
| 9/25/1911 | 72.94 | 93.38 | 28.0% | n/a | |||||||
| 12/24/1914 | 53.17 | 98.36 | 85.0% | n/a | |||||||
| 12/19/1917 | 65.95 | 82.4 | 24.9% | n/a | |||||||
| 8/24/1921 | 63.90 | 99.71 | 56.0% | n/a | |||||||
| 10/27/1923 | 85.76 | 101.73 | 18.6% | 152.92 | 50.3% | 151.87 | -0.7% | 183.96 | 21.1% | 255.51 | 38.9% |
| 7/8/1932 | 41.22 | 105.15 | 155.1% | 97.15 | -7.6% | 122.55 | 26.1% | 156.1 | 27.4% | n/a | |
| 3/31/1938 | 98.95 | n/a (topped 11/12/38 @ 1568.41 +60.1% for that partial year) | |||||||||
| 4/28/1942 | 92.92 | 134.14 | 44.4% | 136.21 | 1.5% | 164.71 | 20.9% | 206.13 | 25.1% | n/a | |
| 6/13/1949 | 161.60 | 226.44 | 40.1% | 250.03 | 10.4% | 268.56 | 7.4% | 265.78 | -1.0% | 322.09 | 21.2% |
| 10/22/1957 | 419.79 | 542.31 | 29.2% | 625.59 | 15.4% | 582.69 | -6.9% | 705.62 | 21.1% | n/a | |
| 6/26/1962 | 535.76 | 709.00 | 32.3% | 830.99 | 17.2% | 854.36 | 2.8% | n/a | |||
| 10/7/1966 | 744.32 | 928.74 | 24.8% | 956.68 | 3.0% | n/a | |||||
| 5/26/1970 | 631.16 | 906.41 | 43.6% | 971.25 | 7.2% | n/a | |||||
| 12/6/1974 | 577.60 | 818.80 | 41.8% | n/a (topped 9/21/1976 @ 1014.79 +22.9% for that partial year) | |||||||
| 2/28/1978 | 742.12 | 808.82 | 8.98% | n/a (topped 2/13/1980 +11.75% for that partial year) | |||||||
| 8/12/1982 | 776.92 | 1182.83 | 52.2% | 1218.09 | 3.0% | 1314.29 | 7.9% | 1835.49 | 39.7% | 2669.32 | 45.4% |
| 10/19/1987 | 1738.74 | 2137.27 | 22.9% | 2683.20 | 25.5% | n/a (topped 7/16/1990 @ 2999.75 +11.8% for that partial year) | |||||
| 10/11/1990 | 2365.10 | 2983.68 | 26.2% | 3136.58 | 5.1% | 3593.41 | 14.6% | 3876.83 | 7.9% | 4735.2 | 22.1 |
| 8/31/1998 | 7539.07 | 10829.28 | 43.6% | n/a (topped 1/14/2000 @ 11722.98 +8.3% for that partial year) | |||||||
| 9/21/2001 | 8235.81 | n/a (topped 3/19/2002 @ 10635.25 +29.1% for that partial year) | |||||||||
| 10/9/2002 | 7286.27 | 9680.01 | 32.9% | 10055.20 | 3.9% | 10292.31 | 2.4% | 11857.81 | 15.2% | 14164.53 | 19.5% |
| 11/20/2008 | 7552.29 | n/a (topped 1/2/2009 @ 9034.69 +19.6% for that partial year) | |||||||||
| 3/9/2009 | 6547.05 | 10564.38 | 61.4% | 12213.09 | 15.6% | n/a (topped 4/29/2011 @ 12810.54 +4.9% for that partial year) | |||||
| 10/3/2011 | 10655.30 | 13494.61 | 26.6% | 14996.48 | 11.1% | 17009.69 | 13.4% | 16472.37 | -3.2% | 18253.85 | 10.8% |
| 12/24/2018 | 21792.20 | 28515.45 | 30.9% | n/a (topped 2/12/2020 @ 29551.42 +3.6% for that partial year) | |||||||
| 3/23/2020 | 18591.93 | 32731.2 | 76.05% | n/a (topped 1/4/2022@ 36799.65 +12.43% for that partial year) | |||||||
| 9/30/2022 | 28,725.51 | 33,507.50 | 16.64% | 42330.15 | 26.33% | n/a (topped 12/4/2024 @ 45,014.04 +6.3% for that partial year) | |||||
| 4/8/2025 | 37645.59 | N/A | |||||||||
| 25 of 30 (83.33%) complete 1st year | Ave.gain: 46.2% of all 25 (not included the most recent one . We wait until reversed by a bear market to update calculations) | 17 of 30 (56.6%) complete 2nd year | Ave.gain: 13.07% | 10 of 30 (33.3%) complete 3rd year | Ave.gain: 8.8% | 9 of 30 (30%) complete 4th year | Ave.gain: 17.0% | 6 of 30 (20%) complete 5th year | Ave.gain: 26.3% | ||
‘Official’ Bull Markets (+19%) and the S&P500 Gain After attaining that status: (Data since 1/1/49)
| "Official" Status | 3 Months: | 6Months: | 9 Months: | 1 year: | |||||
|---|---|---|---|---|---|---|---|---|---|
| Date | Level | level | gain | level | gain | level | gain | level | gain |
| 11/2/1949 | 16.33 | 17.23 | 5.5% | 18.11 | 10.9% | 17.95 | 9.9% | 19.73 | 20.8% |
| 7/25/1958 | 46.97 | 50.81 | 8.2% | 56.oo | 19.2% | 57.96 | 23.4% | 59.65 | 27.0% |
| 11/29/1962 | 62.41 | 64.29 | 3.0% | 70.01 | 12.2% | 72.04 | 15.4% | 73.23 | 17.3% |
| 4/24/1967 | 92.62 | 93.73 | 1.2% | 94.42 | 1.9% | 93.17 | 0.6% | 96.62 | 4.3% |
| 9/4/1970 | 82.83 | 89.46 | 8.0% | 97.92 | 18.2% | 101.3 | 22.3% | 100.69 | 21.6% |
| 2/3/1975 | 77.82 | 89.22 | 14.6% | 87.99 | 13.1% | 89.04 | 14.4% | 100.87 | 29.6% |
| 8/3/1978 | 103.51 | 96.18 | -7.1% | 99.5 | -3.9% | 101.81 | -1.6% | 104.04 | 0.5% |
| 9/3/1982 | 122.68 | 138.69 | 13.1% | 153.48 | 25.1% | 164.42 | 34.0% | 165.00 | 34.5% |
| 2/29/1988 | 267.82 | 253.42 | -5.4% | 262.33 | -2.0% | 270.91 | 1.2% | 288.86 | 7.9% |
| 2/6/1991 | 358.07 | 380.08 | 6.1% | 390.62 | 9.1% | 389.97 | 8.9% | 408.79 | 14.2% |
| 11/6/1998 | 1141.01 | 1239.4 | 8.6% | 1332.05 | 16.7% | 1300.29 | 14.0% | 1370.23 | 20.1% |
| 11/19/2001 | 1151.06 | 1083.34 | -5.9% | 1106.59 | -3.9% | 920.47* | -20.0% | ||
| 11/21/2002 | 933.76 | 848.17 | -9.2% | 923.42 | -1.1% | 1003.27 | 7.4% | 1035.28 | 10.9% |
| 1/2/2009 | 931.80 | 778.94** | -16.4% | ||||||
| 3/26/2009 | 832.86 | 918.9 | 10.3% | 1044.38 | 25.4% | 1126.48 | 35.3% | 1166.59 | 40.1% |
| 1/20/2012 | 1315.38 | 1378.53 | 4.80% | 1362.66 | 3.50% | 1433.19 | 9.00% | 1485.98 | 12.96% |
| 3/1/2019 | 2803.69 | 2752.06 | -1.80% | 2926.46 | 4.38% | 3140.98 | 12.03% | 2746.55*** | -1.68% |
| 4/6/2020 | 2663.68 | 3179.72 | 19.3% | 3360.95 | 26.2% | 3748.14 | 40.71% | 4073.94 | 52.9% |
| 6/13/2023 | 4369.01 | 4467.44 | 2.25% | 4707.09 | 7.74% | 5175.27 | 18.45% | 5421.03 | 24.08% |
| 7/13/2025 | 6279.35 | ||||||||
| Average: | 3.11% | 10.15% | 13.63% | 19.83% |
|||||
| Median: | 4.80% | 10.00% | 13.02% | 20.10% |