BEAR markets have been defined as:
A 9 % drop (if followed by a recession) – MONEY Magazine (October 1998).
A 13 % drop (after 155 days) – Ned Davis Research in the Wall St. Journal (3/20/95).
A 15 % drop – David L. Babson & Co. in the White Mt. Independent (9/4/98), The Wall Street Journal (1/27/95) and Forbes (6/12/00) on the S&P.
A 16 % drop on both the Dow Jones and the S&P500 over any timeframe- SchannepTiming & TheDowTheory.com Newsletter (1995).
An 18% drop on the S&P 500 – Standard & Poor’s (3/25/01)
A 20 % drop on the Dow Jones– Dow Jones & Co: Wall St. Journal (10/12/90) the day of the Desert Storm Bear market low.
A 20 % drop (over at least three months) –Wall St. Journal (11/28/94) after Desert Storm.
A 20-25 % drop – Morgan Stanley Dean Witter (8/13/98).
A 22-23 % drop – State Street Research in the Wall St. Journal (9/11/98).
A 30 % drop (after 50 days) – Ned Davis Research in the Wall St. Journal (3/20/95).
“‘A lot‘ of stocks going down ‘a lot‘ over a long period of time” -Morgan Stanley Dean Witter (12/3/98).
“A long downward movement interrupted by important rallies”- Robert Rhea “The Dow Theory” (1932).
No wonder there is confusion about Bear markets, some definitions require that you wait for 3 to 5 months, or for however long it takes to see if there is going to be a recession. Usually, (73% of the time in the case of my definition) Bear markets “forecast” recessions. By using the “traditional” 20% definition, the 1923 Bear market (-18.6%) and its following recession, the 1956-7 Bear market (-19.4 %) and its following recession, and the 1978-80 Bear market (-16.4 %) and its following recession, were missed. Even The Wall Street Journal (10/21/29) referred to 1923’s -18.6% drop as “a genuine major Bear market”, and no serious observer can dismiss 2000-01 as anything less. The Wall Street Journal has stated that “there is no formal way to define bull and bear markets” (12/15/98). I disagree.
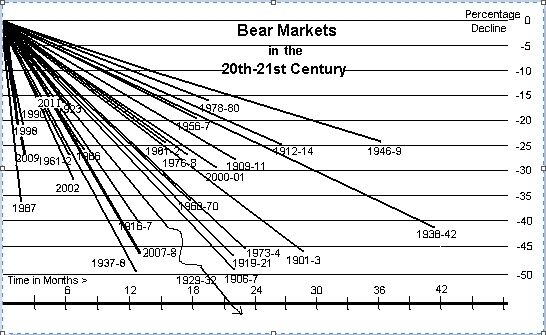
The stock market has had declines of 10% some 50 to 100 times in the 20th century, yet that alone has not resulted in Bear markets. In addition to being an excellent forecasting tool for predicting recessions when using my definition of Bear markets, the threshold of -16 % has resulted 80 %** of the time in declines of at least -24 %. The average loss for Bear markets has been -34 % over a year and a half’s time. 73% of the time the -16% definition has been followed by a recession. It happens that -16 % is the reciprocal of a 19 % advance (and vice versa), which is my definition of a Bull market. It takes a 19% gain to make up for a -16% loss, and vice-versa. See Special Report- Bull markets in the 20th-21st Centuries. The attached graph shows the 26 previous Bear markets of the 20th-21st century, which are enumerated in the Historic Record under “Resources” in the “Bull & Bear” section.
Following the graph you will see the data on what happens after a Bear market becomes ‘official’.
Since 1946 the Dow Jones Company’s, definition (-20% for the Dow) has identified 13 of 16 Bear markets which preceded 7 recessions and a ‘soft landing’.
The Standard & Poor’s Company’s definition (-18% for the S&P) identified 14 of the 16 which preceded 9 recessions and a ‘soft landings’.
My definition (-16% on both the Dow Jones AND S&P 500) identified all 16 which preceded 10 recessions and a ‘soft landings’.
** ‘Mini’-Bull markets lasting an average of 3.2 months and rising less than 40 points on average are excluded from this tabulation which eliminates the 10 aberrations of the 1930’s. Details may be found in the Bull & Bear section of our Web site, and have previously been supplied to readers of this Letter.

After Bear markets become ‘official’ the following are the results:
‘Official’ Bear Markets (-16% on BOTH the DJIA & S&P500) and the further S&P500 Loss to the final lows: (Data since 1/1/46)
Final Bear Market Lows:
| Date of -16% | Level: | Date final bottom | level at bottom | further loss: | months to low: | Recession? | ||
|---|---|---|---|---|---|---|---|---|
| 9/4/1946 | 15.46 | 5/17/47 | 163.21 | YES | ||||
| ?/?/47-48 | 6/13/1949 | 13.55 | % | NO | ||||
| 10/17/1957 | 40.65 | 10/22/1957 | 38.98 | 4.1% | 0.6 | YES | ||
| 5/25/1962 | 59.47 | 6/26/1962 | 52.32 | 12.0% | 1 | NO | ||
| 8/22/1966 | 78.24 | 10/7/1966 | 73.2 | 6.4% | 1.5 | NO | ||
| 7/28/1969 | 90.21 | 5/26/1970 | 69.29 | 23.2% | 10 | YES | ||
| 8/21/1973 | 100.89 | 10/3/1974 | 62.28 | 38.3% | 14.5 | YES | ||
| 1/10/1978 | 90.17 | 3/6/1978 | 86.90 | 3.6% | 1.9 | NO | ||
| 9/8/1981 | 117.98 | 8/12/1982 | 102.42 | 13.19% | 11.2 | YES | ||
| 10/16/1987 | 282.7 | 12/4/1987 | 223.92 | 20.8% | 1.6 | NO | ||
| 8/23/1990 | 307.06 | 10/11/1990 | 295.46 | 3.8% | 1.6 | YES | ||
| 8/31/1998 | 957.28 | 8/31/1998 | 957.28 | 0.0% | 0 | NO | ||
| 3/16/2001 | 1150.53 | 9/21/2001 | 965.8 | 16.1% | 6.2 | YES | ||
| 7/10/2002 | 920.47 | 10/9/2002 | 776.76 | 15.6% | 2 | NO | ||
| 3/7/2008 | 1293.37 | 11/20/2008 | 752.44 | 41.8% | 8.5 | YES | ||
| 2/19/2009 | 778.94 | 3/9/2009 | 676.53 | 13.1% | 0.7 | YES | ||
| 8/10/2011 | 1120.76 | 10/3/2011 | 1099.23 | 1.9% | 1.8 | NO | ||
| 12/21/2018 | 2416.62 | 12/24/2018 | 2351.10 | 2.4% | 0 | NO | ||
| 3/9/2020 | 2746.55 | 3/23/2020 | 2237.40 | 18.5% | 0 | YES | ||
| 6/13/2022 | 3749.63 | 10/12/2022 | 3,577.03 | 4.6% | 4 | NO but Q1 & Q2 2023 negative GDP followed by earnings recession | ||
| 4/8/2025 | 4,982.77 | 4/8/2025 | 4982.77 | 0% | 0 | NO | ||
| Average: | 12.6% | 3.53 |
By the time bear markets become ‘official’ the majority of the decline has happened, although another 12.53% (on average) is likely over the following 4 to 6 months (on average).
When the market goes down -16% it has then gone down further than -20% on 77% of those times.
The average bear market decline since 1946 has been -26.91% lasting 10.33 months.
8 of the last 10 recessions were signaled by bear markets, 2 were not.
8 of the last 15 bear markets signaled recessions, 6 did not. The two consecutive quarters of GDP contractions in Q1 & Q2 2002 were not officially labeled as a recession and were coupled with the 2022 Bear market.