Capitulation – The Ultimate Bear Market Low Indicator
(A paper submitted in the “Charles H. Dow Award” competition
of the Market Technicians Association in 2005)
Please note this report has not been updated, click HERE for updates on Capitulation
Throughout the history of the stock market there have been innumerable attempts to determine when bear markets are ending and new bull markets are about to begin. It is always difficult to predict when any existing trend will change, since one of the laws of physics is that a body in motion tends to stay in motion in the same direction. The difficulty is compounded in the stock market by the need to overcome the negativity and despair that is often found during bear markets. The rewards of being correct can be substantial, however, as the advance from the lows into the first several months of a new bull market is usually the strongest of the entire bull market that follows. I will discuss and compare the eight best indicators that attempt to identify Bear market bottoms and indeed, have identified half of the bear market bottoms during the period of their existence. You will see that none of the others has proven to be as accurate as my Capitulation Indicator which has identified eight of the last twelve market bottoms.
Before we compare any indicator’s ability to spot a bear market bottom, hence the beginning of a new bull market, we must have a clear definition for both. Bear market definitions vary from “a nine percent drop (if followed by a recession)” Money Magazine1, to “a long downward movement interrupted by important rallies” The Dow Theory2. Some sources require as much as a 30% drop3 in the indices to qualify as a bear market, but a 20% drop4 is most frequently used. My definition of a bear market is a drop of 16% on both the Dow Jones Industrial Average and the Standard & Poor’s 500 Index. The threshold of minus 16% has resulted in declines of at least 24% nearly 80% of the time. In addition, 16% drops have been followed by a recession over 70% of the time, but requiring a 20% decline has resulted in missing the recessions of 1923-4, 1957-8 and 1980, which were signaled by the 16% definition. It just so happens that a 16% drop is the reciprocal of a 19% rise (it takes a 19% gain to make up for a 16% loss), which is my definition of a bull market (a 19% rise in both the Dow Jones Industrials and the S&P500 indices). When reaching the 19% threshold the market has continued to advance above 29%, 95% of the time! More than half of these markets rose over 75%, with the average gain posting 115% with a duration of nearly three years (excluding the aberrations of the 1930’s). 100% of the bull markets of the 20th and 21st Centuries have been accompanied by, or followed shortly thereafter by, economic expansions.
A brief explanation of the eight best indicators for identifying bear market lows follows:
The Equity-only Put/Call Ratio (the volume of puts traded divided by the volume of calls) is a contrary indicator. To paraphrase Paul Cherney, Chief Market Analyst at Standard & Poor’s, “Put/Call ratios are used to quantify extremes in sentiment. The higher number of puts traded versus calls, the greater the possibility that the stock market is at or near the bottom.” 5 Early attempts to identify market bottoms were based on a .75 ratio which was negated as the ETFs (exchange traded funds) such as DIA, SPY and QQQQ were added. However, back-testing this method using a ratio of 1.0 or higher, using the first day, if there are multiple days, when such a signal has occurred at least a month after a previous occurrence, has resulted in the record shown in the Appendix to this report, as are the records of the other indicators to follow. This ratio can be determined from data available at www.cboe.com. It identified four bear market lows, missed one, and had one extraneous but NO false signals. An extraneous signal, which occurs in an existing bull market, may have its place, but not in this study whose purpose is to identify bear market lows and the turn to a new bull market. False signals occur in bear markets but not at or near the lows.
Net Cash Into/Out of Equity Funds is another contrary indicator whereas investors pour money into equity mutual funds when they are optimistic and pull funds out when they are bearish. The Investment Company Institute (www.ici.org) and TrimTabs (www.trimtabs.com) report these numbers shortly after each month-end. When the net withdrawal of funds spikes downward during a reported month and then turns up the following month, delineating the spike, a signal is generating. The problem is in defining a spike and deciding which day or week it could be identified which makes this indicator rather subjective. It identified the last five bear market lows, missed five, and had three extraneous and two false signals.
New 52 Week Lows as a Percentage of Issues Traded has been available since January 1978 when the NYSE began calculating new lows (of individual issues) on a trailing 52-week basis. The data is available daily in the Wall Street Journal and elsewhere. Paul Cherney of S&P MarketScope describes the “surge in new lows means that people have been dumping stocks at virtually any price. It indicates that the markets are in the throes of a capitulation, but the capitulation might not have seen its low close yet.” 6 This signal is generated using the second day, to eliminate one day wonders, when the percentage move is greater than fifteen percent, and has not occurred within a month of a previous such move. The back-tested results of this indicator has identified six bear market lows, missed two, and had two extraneous and two false signals.
The CBOE Volatility Index (VIX) is described by the Chicago Board Options Exchange, where its data is posted (www.cboe.com), as being the benchmark for stock market volatility. It measures investors’ expectations of near term volatility based on the prices of stock index options. Presently, it uses out-of-the-money put and call options on the S&P500 Index with a constant maturity of 30 days to expiration. A level of 42 is the number that has identified the lows since 1998. Unfortunately this Index was only started in 1993 and then revised in 2003 with back-testing only to 1990. Because its record is so brief and totally a result of hindsight, it is unfair to rate it above the others with longer-term records. This indicator identified three bear market lows, missed one, and had NO extraneous or false signals.
Lowry’s Reports “90%” Indicator won the “Charles H. Dow Award” for Paul Desmond in 2002, available at www.lowrysreports.com or at www.mta.org. In order to generate a signal, several criteria must be met: Downside Volume must equal at least 90% of the total of Upside Volume plus Downside Volume; Points Lost must be at least 90% of the sum of Points Gained and Points Lost; Followed in fairly short order by one 90% Upside Day, or two 80% Upside Days. There is some ambiguity in the 90% Indicator in that the usual magic number signaling the end of a bear market is 90, but can also be 80. Since 1960 this Indicator correctly identified nine bear market bottoms and missed three. Unfortunately over that same time period it created sixteen extraneous signals and three false signals. The record shown in the Appendix has used two or more days of downside to precede a signal, since when one day was used considerably more extraneous and false signals were generated.
The Arms Index developed in 1967 by Richard Arms Jr. of the ARMS Advisory, also known as TRIN, an acronym for Trading Index, is generally considered to be primarily a short-term trading tool. It is determined by dividing the Advance/Decline ratio by the Upside/Downside volume ratio. It can be found daily in the Wall Street Journal. If there was 1 advancing stock for each 3 declining stocks (1/3 = .33), and if upside volume was outnumbered by declining volume by 10 times (1/10 + .10) the resultant Index level would be 3.3 (.33/.10). A number of 3 or higher has identified six bear market bottoms, missed four, and had thirteen extraneous signals and six false signals.
The 200 Day Moving Average is used by many investors to determine the trend and direction of the market. It is most dependable, however, when the Dow Jones and the S&P500 are each 20% below their respective 200 day moving averages. My thanks to Paul Cherney of S&P MarketScope for running the numbers for me so I was able to construct the historic record. Numerous Internet chart services such as www.bigcharts.com or www.stockcharts.com show the 200-Day moving average. When both the Dow Jones Industrials and the S&P500 have descended to such extreme low levels the market has been at or near six bear market bottom, six bottoms were missed but there were no extraneous or false signals.
When the percent of NYSE stocks trading above their 10-Week Moving Averages drops to 10% it can be another indication of market bottoms. I mention it because I believe it may have promise but do not include it because the past data that I have been able to obtain have not indicated exact days, or even exact months. In addition the charts have been revised recently thus making continuity impossible. It is worth watching at www.InvestorsIntelligence.com, but since I cannot vouch for its record I cannot recommend it along with the others.
The following is the most successful of any of the indicators that I am aware of that have a capability for determining when a bear market is ending and a new bull market beginning:
My Capitulation Indicator identifies the capitulation that often accompanies bear market bottoms. Capitulation as it relates to the stock market occurs when investors and/or speculators abandon equities because they are so disheartened, fearful, need to meet margin calls, or for whatever reason sell en masse. This is often called a selling climax as stocks cascade down into a cataclysmic sell-off. Charles Dow or any of his successors in writings about Dow’s theory did not utter the word capitulation, but it was clearly alluded to in the early 20th century. Robert Rhea described the third and final phase of a bear market in The Dow Theory in 1932 as “caused by distress selling of sound securities, regardless of their value, by those who must find a cash market for at least a portion of their assets.”7 Rhea also wrote, “After a market has drastically declined…and then goes into a semi-panic collapse, it is wise to cover short positions and even perhaps make commitments for long account.“ 8
The calculations that I use to identify these capitulations were developed in the mid-1960’s by the COMPARE (Computer Assistance to Research) Department at Dean Witter & Co. and the data was first published in 1969. A short-term oscillator9 is utilized which measures the percent of divergence between the three major stock market indices (Dow Jones Industrial Average, S&P500 and the New York Stock Exchange Composite) and their ten-week, time-weighted moving averages. Several chart services such as www.profit.net show a similar exponentially smoothed 50-day moving average (EMA). EMA’s reduce the lag by applying more weight to recent prices relative to older prices. An explanation of EMA’s can be found in numerous texts and websites such as www.stockcharts.com/education/IndicatorAnalysis. Market bottoms are identified when the divergence between the three major stock market indices is 10% below their respective ten-week, exponentially time-weighted moving averages, and has only been signaled fifteen (updated) times in the last 50 years. The date used is the first day the level was attained. My database covers back to 1953 and I have personally calculated and maintained the database for many years since Dean Witter, now Morgan Stanley, long ago abandoned the Department responsible for its updating. This Indicator has identified ten (updated) of the last fourteen (updated) bear market bottoms, including the last eight (updated) market bottoms on a real time basis! It had no signal at four other bottoms – some bear markets end with a whimper – and has never generated a false or extraneous signal.
Its signals were the best of all eight indicators at seven of the ten bottoms which were identified by any of the indicators, as you will see in Exhibit One. It came in second-best one time when its signal was one day early! A critical advantage over the other indicators is that the market levels that would cause the threshold of capitulation to be reached can be, and has been, calculated and communicated during the week prior to its happening so that investors can get a heads-up ahead of time.
In summary, all the Indicators have identified at least half of the market bottoms during the period of their existence, at or near the time they were entering new bull markets. Of the last twelve bear market bottoms, only 1978 and 1982 were not identified by one or more of these indicators. Lowry’s and my Capitulation Indicator captured 2/3rds of those markets lows over the last 43 years. The following chart shows a large “X” indicating which signal(s) was closest in market level to the actual low point of the bear market. A small “x” indicates that a signal was also given, but was not the closest. The record clearly indicates that bear market bottoms CAN be identified by one or more methods, even 8 different ways, as was the case for 2002.
With definitions and explanations in place the results are shown below:
(Exhibit One)
Bear Low | Capitulation | Lowry’s | Arms | Lows/Total | 200Day | Inflow/Out | VIX | Put/Call |
|---|---|---|---|---|---|---|---|---|
1962 | X | x | n/a | n/a | x | n/a | n/a | n/a |
1966 | no signal | X | n/a | n/a | no signal | n/a | n/a | n/a |
1970 | X | x | x | n/a | X | no signal | n/a | n/a |
1974 | X | x | x | n/a | x | no signal | n/a | n/a |
1978 | no signal | no signal | no signal | no signal | no signal | no signal | n/a | n/a |
1980 | no signal | x | X | x | no signal | no signal | n/a | n/a |
1982 | no signal | no signal | no signal | no signal | no signal | no signal | n/a | n/a |
1987 | X | x | X | X | X | x | n/a | x |
1990 | X | x | no signal | x | no signal | x | no signal | no signal |
1998 | X | x | X | x | no signal | x | X | x |
2001 | X | no signal | no signal | x | X | x | X | x |
2002 | X | no signal | x | x* | x | x | x | x |
# Identified see note (1) | 8 | 8 | 6 | 6 | 6 | 5 | 3 | 4 |
# times BEST | 8 | 1 | 3 | 1 | 3 | 0 | 2 | 0 |
# Missed | 4 | 4 | 4 | 2 | 6 | 5 | 1 | 1 |
Extraneous(2) | 0 | 16 | 13 | 2 | 0Â | 3 | 0 | 1 |
# False (3) | 0 | 3 | 6 | 2 | 0 | 2 | 0 | 0 |
n/a = Indicator or data not available.
* Missed THE low by one day.
Actually, Lowry’s 2002 low signal was in March of 2003 but was within 10% of the low.
(1) Signaled low within 2 months and/or 10% of the low point.
(2) Signaled in already existing bull market, may have been useful but not for picking the bottom.
(3) Signaled during bear market but more than 3 months premature to the bottom.
So how does it work out in the stock market? The following shows the results for the S&P500 three months, six months, nine months and a year after the Capitulation Signal with the average gains being +11%, +18.5%, +24.7% and +25.4% respectively:
(Exhibit Two)
My Capitulation BUY Signals and the S&P500 Gain After:
(Data since 12/31/1953)
| BUY: | 3 Months: | 6 Months: | 9 Months: | 1 Year: | |||||||
|---|---|---|---|---|---|---|---|---|---|---|---|
| Date | Level | level | gain | level | gain | level | gain | level | gain | ||
| 1) 6/22/1962 | 52.68 | 57.69 | 9.50% | 62.64 | 18.90% | 66.19 | 25.60% | 70.25 | 33.40% | ||
| 2) 5/25/1970 | 70.25 | 81.12 | 15.50% | 85.09 | 21.10% | 96.92 | 38.00% | 99.47 | 41.60% | ||
| 3) 8/23/1974 | 71.55 | 68.9 | -3.70% | 82.62 | 15.50% | 90.58 | 26.60% | 84.28 | 17.80% | ||
| 4) 9/30/1974 | 63.54 | 67.16 | 5.70% | 83.85 | 32.00% | 95.19 | 49.80% | 83.87 | 32.00% | ||
| 5) 10/19/1987 | 224.84 | 249.32 | 10.90% | 257.92 | 14.70% | 268.47 | 19.40% | 276.97 | 23.20% | ||
| 6) 12/3/1987 | 225.21 | 267.88 | 18.90% | 266.45 | 18.30% | 264.48 | 17.40% | 271.81 | 20.70% | ||
| 7) 8/23/1990 | 307.06 | 315.1 | 2.60% | 365.65 | 19.10% | 374.96 | 22.10% | 394.17 | 28.40% | ||
| 8) 8/31/1998 | 957.28 | 1163.63 | 21.60% | 1238.33 | 29.40% | 1301.84 | 36.00% | 1320.41 | 37.90% | ||
| 9) 9/20/2001* | 984.54 | 1139.93 | 15.80% | 1151.85 | 17.00% | 1006.29 | 2.20% | 920.47 | -6.50% | ||
| 10) 7/19/2002 | 847.76 | 884.39 | 4.30% | 901.78 | 6.40% | 893.58 | 5.40% | 993.32 | 17.20% | ||
| 11) 10/9/2002 | 776.76 | 927.58 | 19.40% | 865.99 | 11.50% | 1002.21 | 29.00% | 1038.73 | 33.70% | ||
| Ave: | 11.00% | 18.50% | 24.70% | 25.40% | |||||||
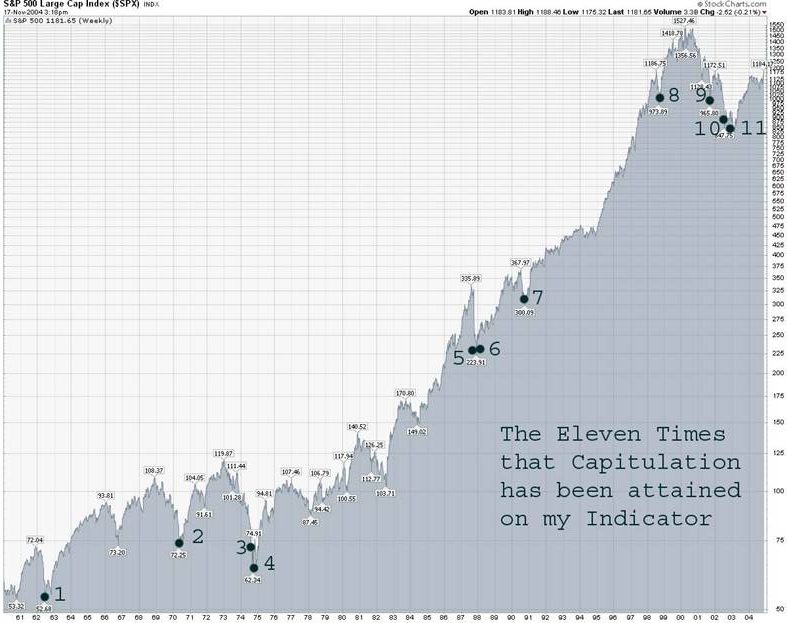
These eleven dates are the only times capitulation has been attained on my Indicator.
Editors Note 1/1/2022: Since this report there have been 6 new capitulation signals with an average 1st year gain of 30.7%. Perhaps the MTA (now the CMT Ass’n) will award a Belated 2005 (as none was awarded that year) or perhaps Posthumous “Charles H. Dow Award” one of these days? Just saying….
*This shortest bull market that began 9/21/01 rose just +21% for the S&P500 (+29% on the Dow) and lasted only 6 months to 3/19/02 and then reverted to an “official” bear market (down -16% on both the Dow Industrials AND the S&P500) on 7/10/02 at the level shown under “1 Year”.

Robert Rhea wrote “Hamilton tells us not to try to use the Dow Theory to pick the day when the lows of a bear market are to be made: ‘No knowledge of the stock market barometer will enable any of us to call the absolute turn from a bear market to a bull market’.”10 That was certainly the case in the first part of the 20th century, but it HAS been possible since the latter part of that century. There is a definite and measurable level of capitulation that comes in at or near market lows. Of the eleven times that capitulation has met the defined levels in my database three have been on THE day of the bear market low, five others have been one to three days before the lows and within 2% of the lows. The average of the eleven was within 3.2% of the low close on the Dow Jones Industrials and/or the S&P500, as can be calculated from the data found in Exhibit Two and the APPENDIX. I have no doubt that Charles Dow would have welcomed the discovery of such a way to clearly identify the “semi-panic collapse” he observed, in order to “make commitments for long account”.
Respectfully Submitted
Jack Schannep
APPENDIX
The specific details of the comparisons for all eight indicators are shown below:
| Bear Market Low: | Arms/TRIN | Days | VIX: | Days | Lowry's 90% | Days | My Capitulation | Days | ||
|---|---|---|---|---|---|---|---|---|---|---|
| Date: | D.J. Ind: | Signal | before | Signal | before | Signal | before | before | ||
| S&P500: | Date: | low: | Date: | low: | Date: | low: | Date: | low: | ||
| 11/10/1960 | extra | |||||||||
| 6/26/1962 | @535.76 | did not | did not | 6/28/1962 | 2 | 6/22/1962* | -4 | |||
| same date | 52.32 | exist | exist | 10/29/62 | extra | |||||
| already | bull mkt: | 6/30/1965 | extra | |||||||
| 9/12/1966 | -25 | |||||||||
| 10/7/1966 | 744.32 | did not | did not | 10/12/1966 | 5 | no signal | ||||
| same date | 73.2 | exist | exist | 10/29/1966 | 22 | |||||
| 6/6/1967 | extra | |||||||||
| 4/8/1968 | extra | |||||||||
| 5/26/1970 | 631.16 | 5/4/1970 | -21 | did not | 5/27/1970 | 1 | 5/25/1970 | -1 | ||
| same date | 69.29 | exist | ||||||||
| already | bull mkt: | 10/18/1970 | extra | |||||||
| 11/3/1970 | extra | |||||||||
| 11/26/1970 | extra | 8/16/1971 | extra | |||||||
| not bear low: | 1/3/1974 | FALSE | ||||||||
| 12/6/1974 | 577.6 | 11/18/1974 | -18 | did not | 1/2/1975 | 27 | 8/23/1974 | -41 | ||
| 10/3/1974 | 62.28 | 36 | exist | 8/28/1975 | extra | 9/30/1974 | -3 | |||
| 1/5/1976 | extra | |||||||||
| not bear low: | 11/10/1977 | FALSE | ||||||||
| 2/28/1978 | 742.12 | no signal | did not | no signal | no signal | |||||
| 3/5/1978 | 86.94 | exist | ||||||||
| (11/14/1978) | 92.49 | 11/1/1978 | 13 | |||||||
| 11/26/1979 | extra | |||||||||
| 4/21/1980 | 759.13 | 3/24/1980 | -3 | did not | no signal | |||||
| 3/27/1980 | 98.22 | exist | 3/28/1980 | 1 | ||||||
| already | bull mkt: | 12/8/1980 | extra | 11/12/80 | extra | |||||
| not bear low | 8/24/1981 | FALSE | ||||||||
| not bear low | 1/5/1982 | FALSE | ||||||||
| not bear low | 1/28/1982 | FALSE | ||||||||
| 8/12/1982 | 776.92 | no signal | did not | no signal | no signal | |||||
| same date | 102.42 | exist | ||||||||
| already | bull mkt: | 10/25/1982 | extra | |||||||
| 7/7/1986 | extra | |||||||||
| 11/18/1986 | extra | 1/2/1987 | extra | |||||||
| 10/19/1987 | 1738.74 | 10/19/1987 | 0 | did not | 10/21/1987 | 2 | 10/19/1987 | 0 | ||
| 12/4/1987 | 223.92 | 11/30/1987 | -4 | exist | 10/29/1987 | 10 | 12/3/1987 | -1 | ||
| 1/4/1988 | 31 | |||||||||
| already | bull mkt: | 1/25/1988 | extra | |||||||
| Bear Market Low: | Arms/TRIN | Days | VIX: | Days | Lowry's 90% | Days | My Capitulation | Days | ||
| 10/13/1989 | extra | 5/31/1988 | extra | |||||||
| 5/11/1990 | extra | |||||||||
| 8/27/1990 | -45 | |||||||||
| 10/11/1990 | 2365.1 | no signal | no sig. | n/a | 11/12/90 | 32 | 8/23/1990 | -49 | ||
| same date | 295.46 | |||||||||
| already | 11/15/1991 | extra | 4/5/1994 | extra | ||||||
| bull | 10/27/1997 | extra | 8/2/1996 | extra | ||||||
| market | 1/9/1998 | extra | ||||||||
| 8/31/1998 | 7539.07 | 8/31/1998 | 0 | 8/31/1998 | 0 | 9/8/1998 | 8 | 8/31/1998 | 0 | |
| same date | 957.28 | |||||||||
| 4/14/2000 | FALSE | |||||||||
| not mkt low | 3/13/2001 | FALSE | ||||||||
| 4/3/2001 | FALSE | |||||||||
| 9/21/2001 | 8235.81 | no signal | 9/20/2001 | -1 | no signal | 9/20/2001 | -1 | |||
| same date | 965.8 | |||||||||
| bull market | 1/29/2002 | extra | ||||||||
| not mkt low | 4/11/2002 | FALSE | ||||||||
| first low of | (7/23/02) | 7/23/2002 | 0 | 7/19/2002 | -4 | |||||
| double bottom | ||||||||||
| 10/9/2002 | 7286.27 | 9/3/2002 | -36 | 10/7/2002 | -2 | no signal | 10/9/2002 | 0 | ||
| same date | 776.76 | @8308 | ||||||||
| 12/27/2002 | @8304 | 3/13/2003 | -154 | |||||||
| bull market | 3/4/2003 | @7705 | @8141.92 | |||||||
| bull market | 3/22/2004 | extra | 3/22/2004 | extra | ||||||
| Arms/TRIN | VIX | Lowry's | My Capitulation | |||||||
| Bear market lows | ||||||||||
| Identified: | 6 | 3** | 9*** | 8* | ||||||
| (last 3) | (incl. last 5) | |||||||||
| Missed: | 4 | 1** | 4 | 4 | ||||||
| (no signal) | (1/2 of last 8) | (1/2 of last 8) | ||||||||
| Extraneous signals: | 13 | 0 | 16 | 0 | ||||||
| False signals: | 6 | 0 | 3 | 0 |
* Only one from backtesting. ** All from backtesting. *** unknown how many from backtesting.
Data for VIX started in 1993 and was backtested to 1990.
My data was live from 1969 and backtested to 1953.
“Signal Date” is the first day in the case of multiple signals.
Lowry’s signals are after at least two “90%” Downside Days followed by a “90%” Upside Day, or Two “80%” Upside Days, as using just one resulted in considerably more false signals than are shown above.
“Days before lows” column is number of calendar days, is a ( – ) if before the low, a ( + ) if after.
The results for the other four:
| Bear Market Low: | Lows/Total | Days | Put/Call | Days | Inflow/ | Days | 200 Day | Days | |||
|---|---|---|---|---|---|---|---|---|---|---|---|
| Date: | D.J. Ave: | Signal | before | Signal | before | outflow | before | before | |||
| S&P500: | Date | low: | Date: | low: | Date: | low: | low: | ||||
| 6/26/1962 | @535.76 | did not exist | did not exist | ? | 6/21/1962 | -5 | |||||
| same | 52.32 | ||||||||||
| 10/7/1966 | 744.32 | did not exist | did not exist | ? | no signal | ||||||
| same | 73.2 | ||||||||||
| 5/26/1970 | 631.16 | did not exist | did not exist | no signal | 5/26/1970 | 0 | |||||
| same | 69.29 | ||||||||||
| already bull mkt | 3/1/1972 | extran | |||||||||
| 12/6/1974 | 577.6 | did not exist | did not exist | no signal | |||||||
| 10/3/1974 | 62.28 | 8/29/1974 | -35 | ||||||||
| already bull mkt | 4/1/1975 | extran | |||||||||
| not bear low | 4/1/1977 | FALSE | |||||||||
| 2/28/1978 | 742.12 | no signal | did not exist | no signal | no signal | ||||||
| 3/6/1978 | 86.9 | ||||||||||
| not bear low | 10/22/1979 | FALSE | |||||||||
| 4/21/1980 | 759.13 | did not exist | |||||||||
| 3/27/1980 | 98.22 | 3/7/1980 | -20 | no signal | no signal | ||||||
| already bull mkt | 6/1/1980 | extran | |||||||||
| not bear low | 9/23/1981 | FALSE | |||||||||
| 8/12/1982 | 776.92 | no signal | did not exist | no signal | no signal | ||||||
| same | 102.42 | ||||||||||
| 10/19/1987 | 1738.74 | 10/19/1987 | 0 | 10/1/1987 | low spike | 10/20/1987 | 1 | ||||
| 12/4/1987 | 223.92 | 12/3/1987 | -1 | confirmed late Dec +25? | |||||||
| 8/17/1990 | -55 | 8/1/1990 | low spike | ||||||||
| 10/11/1990 | 2365.1 | 9/25/1990 | -16 | no signal | confirmed early Oct -5? | ||||||
| same | 295.46 | no signal | |||||||||
| already bull mkt | 4/4/1994 | extra | |||||||||
| 8/31/1998 | 7539.07 | 8/5/1998 | -26 | 8/21/1998 | -10 | 8/1/1998 | low spike | no signal | |||
| same | 957.28 | 10/8/1998 | 38 | 10/8/1998 | 38 | confirmed early Oct +36? | |||||
| not bear low | 3/1/2001 | FALSE | |||||||||
| 9/21/2001 | 8235.81 | 9/19/2001 | -2 | 9/17/2001 | -4 | 9/1/2001 | low spike | 9/20/2001 | -1 | ||
| same | 965.8 | confirmed early Nov +46? | |||||||||
| already bull mkt | 2/15/2002 | extra | |||||||||
| 6/21/2002 | -33 | ||||||||||
| first low | (7/23/02) | 7/24/2002 | -1 | 7/19/2002 | -5 | 7/2/2002 | low spike | 7/22/2002 | -1 | ||
| double bottom | 9/17/2002 | -22 | confirmed early Sep +45? | ||||||||
| 9/18/2002 | -21 | ||||||||||
| 9/19/2002 | -20 | ||||||||||
| 10/9/2002 | 7286.27 | 10/10/2002 | -1 | 9/20/2002 | -19 | 9/30/2002 | -9 | ||||
| same | 776.76 | 5/10/2004 | extra | ||||||||
| Lows/Total | Put/Call | Inflow/Outflow | 200 Day | ||||||||
| Bear market lows | |||||||||||
| identified: | 6 | 4 | 5 | 6 | |||||||
| (includes last 5) | (includes last 3) | (last 5) | |||||||||
| Missed: | 2 | 1 | 5 | 6 | |||||||
| (no signal) | |||||||||||
| Extraneous: | 2 | 1 | 3 | 0 | |||||||
| False signals: | 2 | 0 | 2 | 0 |
BIBLIOGRAPHY
1 Michael Sivy, Money Magazine (October 1998), p.131
2 Robert Rhea, The Dow Theory (1932), New York; Barron’s. Reprinted Burlington VT;
Frazier Printing Co, 1993, p.37
3 Dave Kansas, The Wall Street Journal (3/20/95) citing Ned Davis Research, p.C1
4 Greg Ip, The Wall Street Journal (9/3/98), C1
5 Paul Cherney, Special Studies (8/24/98), S & P Marketscope
6 Cherney, Special Studies (10/18/99), S & P Marketscope
7 Rhea, The Dow Theory, p. 37
8 Ibid., p. 55
9 Richard Capalbo, COMPARE, WHAT IT IS AND HOW TO USE IT (April 1972), New
York, Dean Witter & Co. Incorporated, p. 7
10 Rhea, The Dow Theory, p. 40