
General Remarks:
In this post, I thoroughly explained the rationale behind using two alternative definitions to appraise secondary reactions.
GOLD AND SILVER
A) Market situation if one appraises secondary reactions not bound by the three weeks dogma.
I explained HERE that gold and silver have been in a primary bear market since 6/21/23.
Following a secondary reaction, a pullback set up GLD and SLV for a primary bull market signal, as I explained HERE.
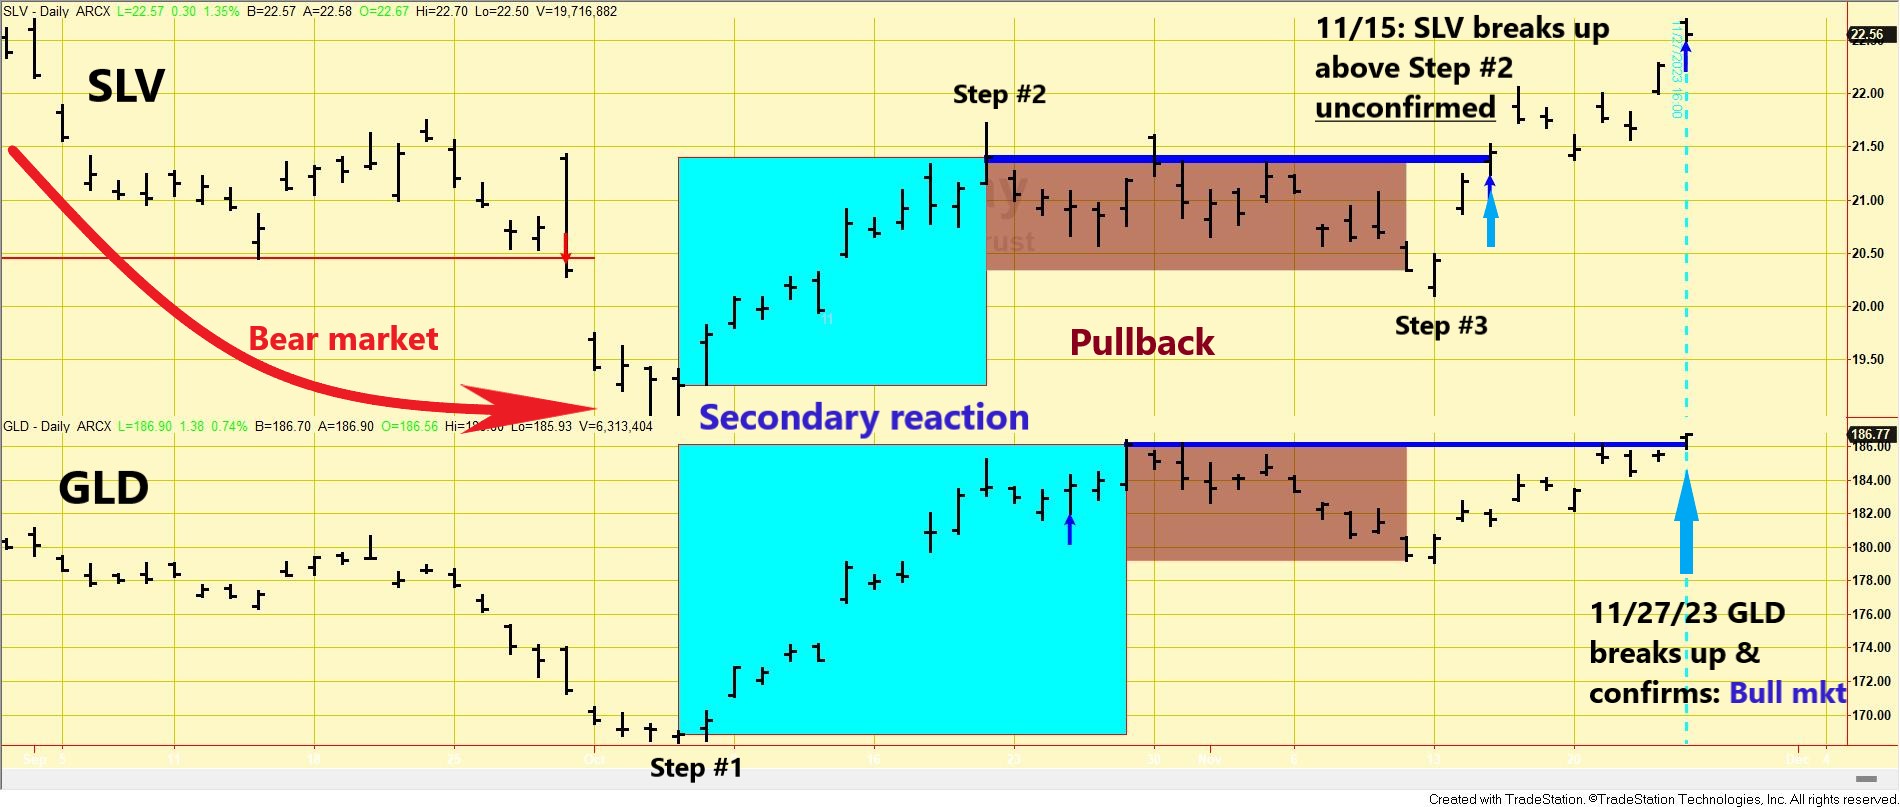
On 11/15/23, SLV surpassed its 10/20/23 secondary reaction highs (Step #2 in the Table below), unconfirmed by GLD. So, absent confirmation, no bull market was signaled. On 11/27/23, GLD finally confirmed by breaking topside its 10/27/23 closing highs (Step #4) , and, accordingly, a primary bull market was signaled. Now, both the primary and secondary trends are bullish.
The Table below contains the details of the price action unfolding from the last recorded bear market lows until 11/27/23 breakup.

The charts below display the most recent price action. The blue horizontal lines highlight the bounce highs (Step #2) which were the key prices to be surpassed to signal a new bull market. The blue rectangles show the secondary (bullish) reaction that unfolded against the then-existing bear market. The brown rectangles highlight the pullback (Step #3) that set up both ETFs for a primary bull market signal.
B) Market situation if one sticks to the traditional interpretation demanding at least three weeks of movement to declare a secondary reaction.
As I explained HERE, the primary trend was signaled as bearish on 6/21/23.
After the 10/5/23 bear market lows (Step #1 in the table below), a bounce followed (Step #2) that satisfied the time requirement for a secondary reaction (at least fifteen trading days confirmed). The extent requirement was also met, as the rally amply exceeded the Volatility-Adjusted Minimum Movement (more about the VAMM HERE).

So, now we are looking for a >= 2-day pullback that would set up GLD and SLV for a potential primary bull market. Hence, the primary trend is bearish, and the secondary one is bullish.
The charts below display the most recent price action. The blue rectangles show the secondary (bullish) reaction that unfolded against the then-existing bear market.

Sincerely,
Manuel Blay
Editor of thedowtheory.com


