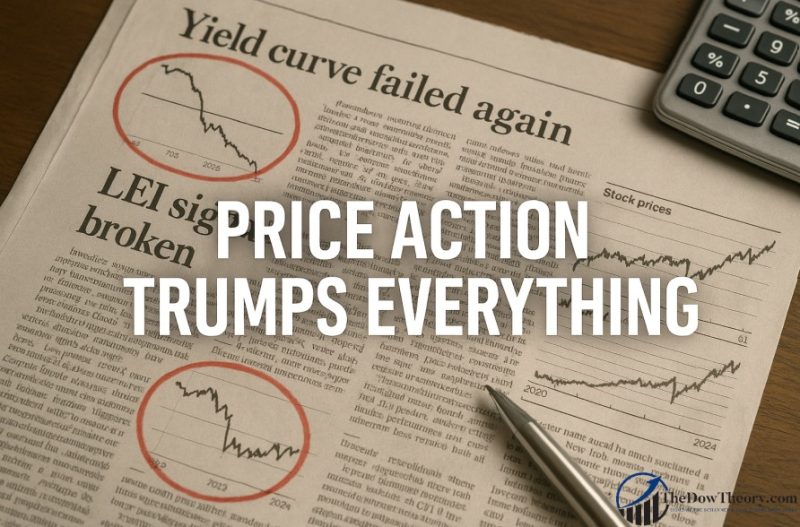
The LEI and yield curve missed the mark. Price action and margin debt told the real story, and we listened.
For decades, investors leaned heavily on two stalwart indicators: the yield curve and the Leading Economic Index (LEI). These tools had an almost mythic reputation for signaling recessions and bear markets.
However, as Jim Paulsen recently pointed out in his piece “Broken Relationships,” both once-reliable guides have lost their mojo.
The LEI, a composite of ten economic indicators, including the yield curve and consumer sentiment, has historically done a remarkable job warning of recessions and, by extension, bear markets. Whenever LEI momentum turned negative, stocks usually followed suit. That pattern held for over 60 years.
Until it didn’t.
As Paulsen notes, the LEI correctly signaled the 2022 bear market. But then something broke. While the S&P 500 bottomed in October 2022 and entered a new bull market, the LEI continued to decline, as shown in the chart below.

That’s unprecedented. The result? Many investors missed out, trapped in recessionary narratives despite clear upward price action.
The other broken relationship Paulsen highlights is bond vigilantism. For years, market watchers feared that rising government deficits would push bond yields higher. That relationship, too, has unraveled. Since the mid-1990s, higher deficits have often been accompanied by lower real bond yields. The vigilantes, if they ever existed, are now ghosts, although I suspect they are about to make a comeback.
As with the LEI, we did not fall prey to the ominous message displayed by a persistent inverted yield curve that lasted more than one year and accompanied the birth of the October 2022 bull market.
What does this mean for us?
It means we must respect history, but we should never become enslaved to it.
At TheDowTheory.com, we’ve monitored the LEI and yield curve throughout 2022, 2023, and 2024. We acknowledged their warnings, but we didn’t fall prey to them. We followed the trend. We followed price action. And it paid off.
Our equity curve says it all:

Here’s the simple truth: price action trumps everything.
If the market is in a bull phase, you act accordingly. You don’t wait for every economic signal to align.
You invest first and ask questions later. That’s not recklessness, that’s responsiveness.
Another indicator we’ve placed consistent trust in and which continues to deliver is margin debt. Unlike surveys or lagging macro data, margin debt reflects real conviction. When investors borrow to increase exposure, it signals bullish sentiment backed by capital. And margin debt trends—especially when rising in tandem with the market—are rarely wrong. Margin investors tend to be more sophisticated, and their actions offer insight that many overlook.
Subscribers to TheDowTheory.com have seen this in real-time. While others fretted over broken indicators, we tracked margin debt trends, watched price action, and remained focused. The result? We did not miss the Bull market that started in October 2022, nor did we miss the one that began on April 8th, 2025.
This is not to say we ignore classic indicators. We keep them on the radar. But when push comes to shove, the final arbiter is the market itself. Fundamentally-based indicators come and go. Narratives break. However, price action is always right.
Sincerely,
Manuel Blay
Editor of thedowtheory.com