
How liquidity and rising wealth explain today’s high valuations in the stock market
Introduction
Many market commentators warn that stock valuations are dangerously high, pointing to elevated price-to-earnings (P/E) ratios and market cap-to-GDP levels as evidence of a bubble. These warnings often rely on outdated benchmarks. What was considered expensive fifty years ago isn’t necessarily expensive today.
Two structural forces have redefined what counts as “normal” valuations. Today’s levels are not irrational but the natural outcome of two powerful trends:
- The persistent expansion of global liquidity.
- Raising capital stock per person has pushed down the natural rate of interest.
Together, these forces have changed the equilibrium level of valuations. A Price-to-Earnings ratio of 20 was considered expensive 50 years ago, but now it can be a good value.
Liquidity growth doesn’t just provide more money to invest; it fundamentally alters risk perception, reduces systemic risk fears, and creates a “risk-on” environment in which investors are willing to pay more for future earnings.
Furthermore, a nearly continuously growing stock of capital per person has reduced discount rates, which further encourages higher valuation multiples.
Misconceptions About Liquidity and Valuations
Many analysts argue that liquidity is “neutral” for valuations. Their reasoning typically takes two forms:
– Liquidity simply inflates earnings. When liquidity increases, prices, sales, and company earnings grow accordingly. Based on this reasoning, valuation metrics like the P/E ratio should remain unchanged because higher stock prices only indicate higher earnings. Therefore, liquidity would affect the “E” in the P/E ratio, but not the “P.”
– Stock market capitalization-to-GDP ratios can’t increase because liquidity inflates GDP. Critics also point to market capitalization versus GDP, arguing that liquidity affects both equally. If GDP is higher due to inflation caused by abundant liquidity, they contend that the market cap-to-GDP ratio should stay stable since both the numerator (market cap) and the denominator are influenced by liquidity.
While intuitive, these arguments miss a crucial point: liquidity not only fuels nominal growth but also changes how risk is priced. It drives a repricing of assets, lifting valuations independently of GDP or earnings growth.
Liquidity as a Valuation Multiplier for the stock market.
Liquidity is more than a measure of money in the system. It is a structural driver of asset pricing. When the growth of global money supply outpaces real GDP, surplus capital competes for a limited pool of assets. This competition raises prices and pushes valuation metrics higher.
The chart below shows the year-on-year percentage change of the S&P 500 compared to global M2 (money supply) over the past 10 years. We see that although the S&P 500’s annual performance might be above or below M2’s yearly growth, they tend to move in lockstep. The S&P 500 lags 6-12 months behind M2 growth, with a correlation ranging between 0.35 and 0.4. The most recent reading suggests that the stock market is neither too overextended nor too depressed.
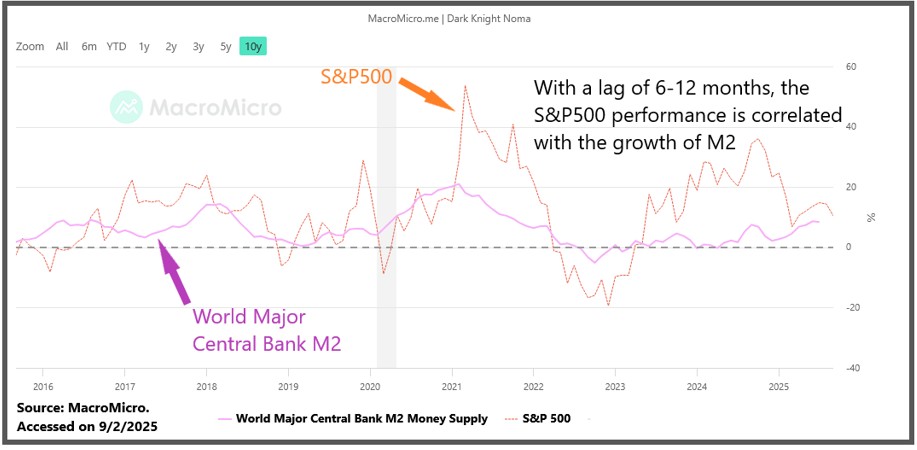
Illustration 1: Source https://en.macromicro.me/charts/101057/Major-Central-Bank-M2-Money-Supply-YoY-vs-S-amp-P-500-amp-NASDAQ-100-YoY Accessed on 9/2/2025.
How does this astounding correlation between liquidity and stock market performance come about?
The key mechanism behind liquidity’s effect on valuations is its ability to alter risk perception.
Abundant liquidity acts as a cushion against systemic risk. Crashes and severe bear markets often emerge from liquidity traps or credit shortages, where even solvent entities cannot secure funding. These crises create downward spirals, forcing investors to demand steep risk premiums. In contrast, liquidity-rich environments do the opposite:
- They reduce systemic risk fears. Investors recognize that abundant liquidity minimizes the likelihood of financial meltdowns, thereby lowering the perceived risk of holding equities and other risk assets.
- They compress volatility expectations. High liquidity levels reduce the probability of market dislocations. Lower expected volatility drives higher valuations because investors are willing to pay more for future cash flows when risks feel manageable.
- They improve market functioning. Deep liquidity allows distressed assets to be absorbed quickly, reducing contagion risk. This stability encourages long-term investors to remain fully invested, adding further upward pressure on prices.
- They encourage a search for yield. With abundant liquidity and low interest rates, investors shift from cash or bonds into equities, boosting demand and driving multiples higher.
This is why liquidity expansions have an asymmetric effect: they push valuations higher much faster than they push GDP or earnings. They change investor psychology and pricing models, making equities and other risk assets appear safer relative to their historical risk profile.
The chart below plots M2 (x-axis top) vs. the PER (y-axis). We observe that M2 tends to grow exponentially as every doubling of M2 occurs in less time. The linear regression shows that the higher M2, the higher the PER.
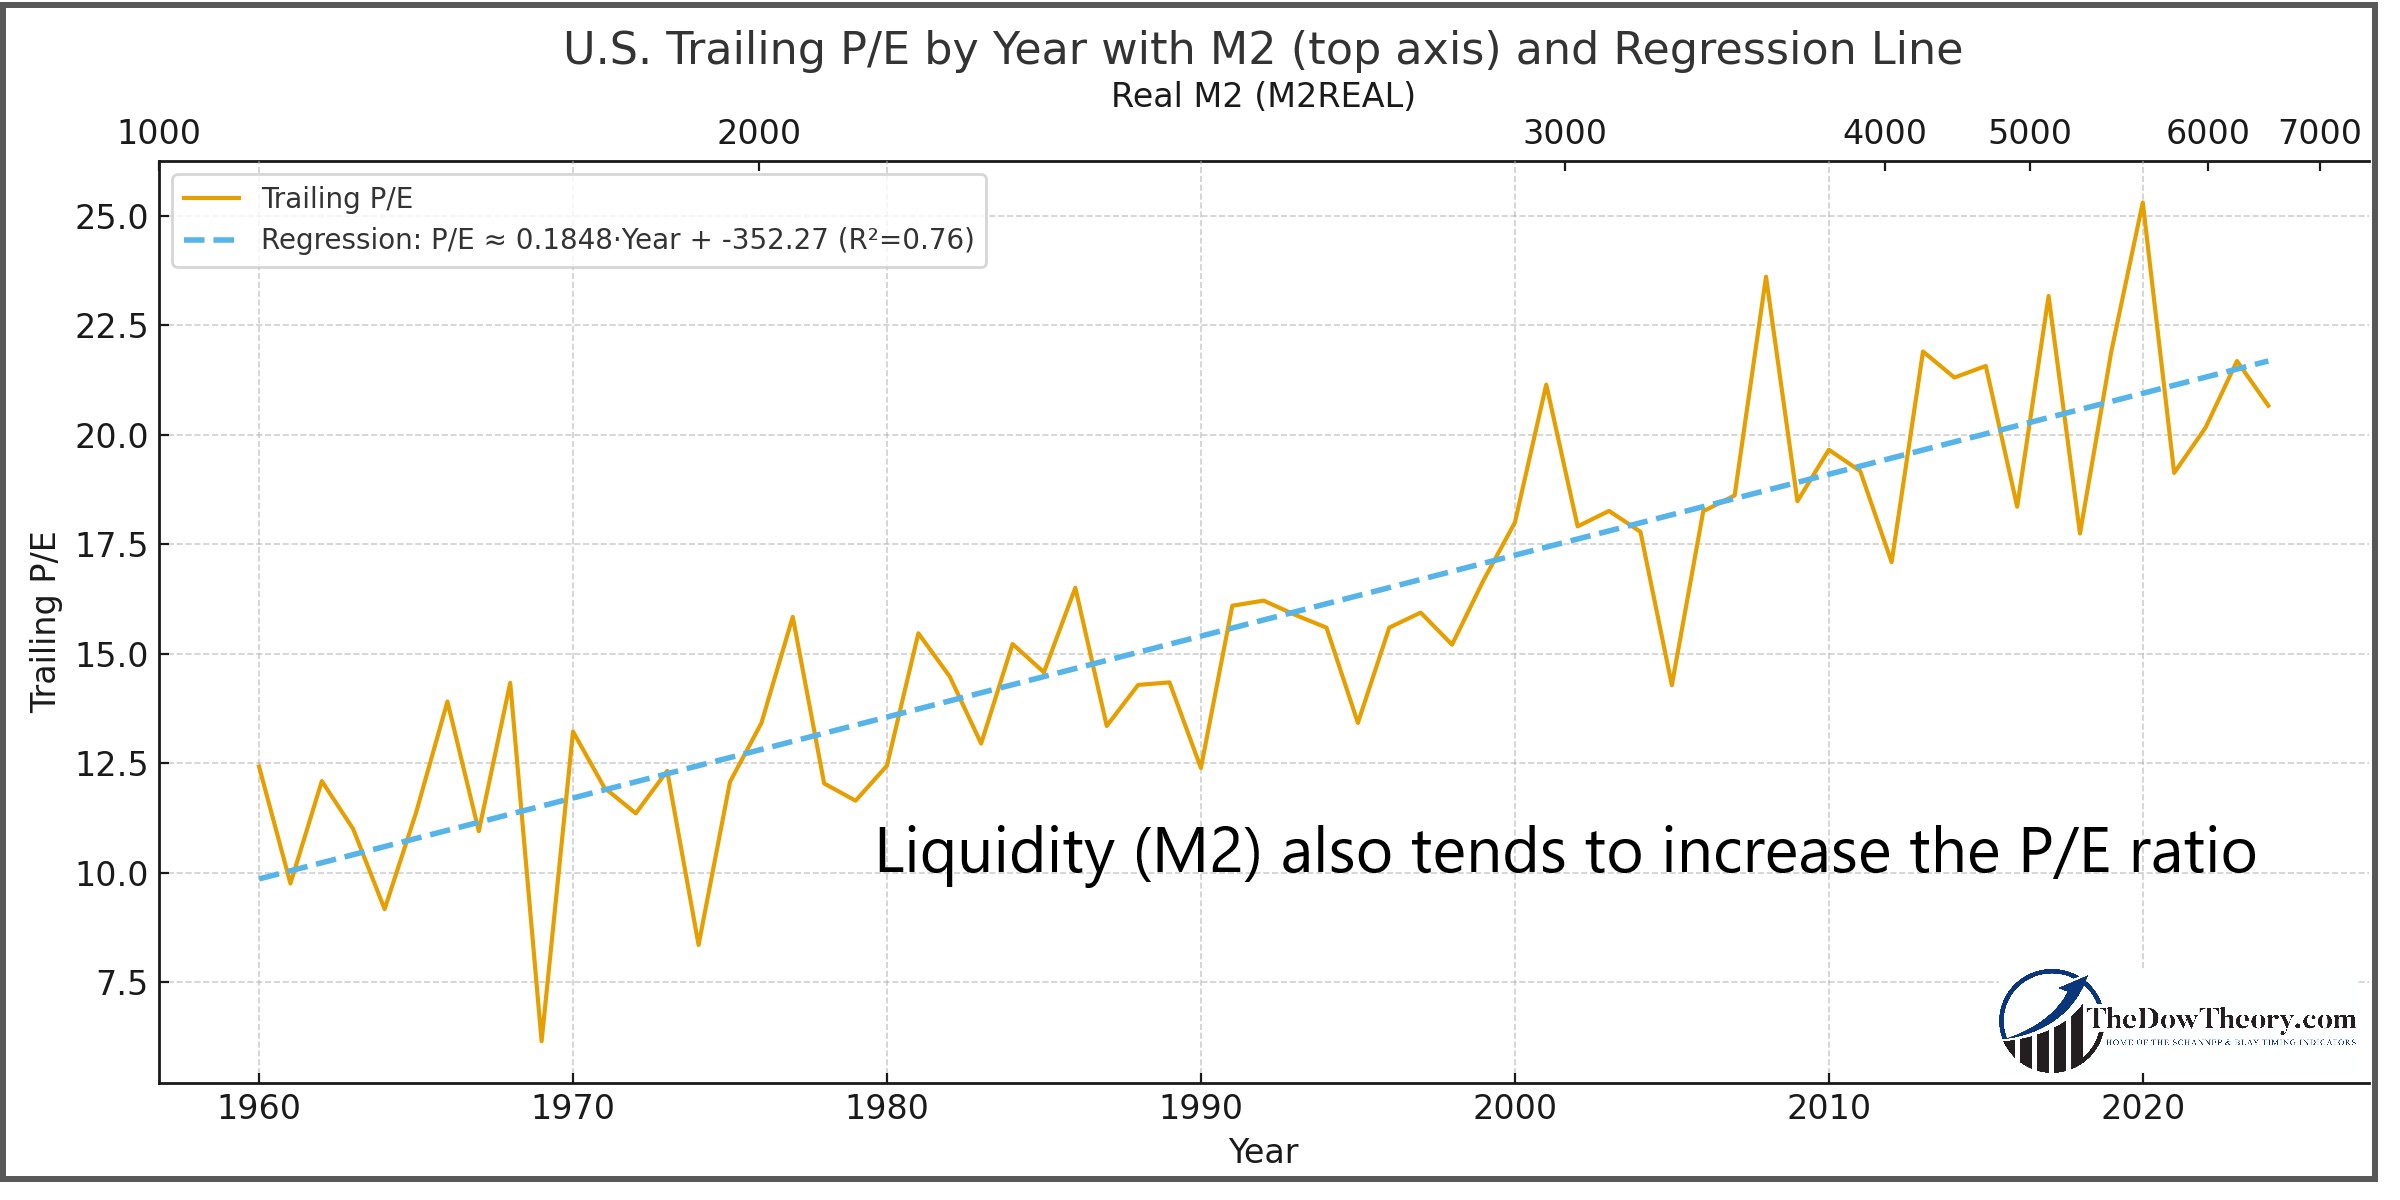
Illustration 2: Correlation M2 and the S&P500 performance.
And what happens to the stock market when liquidity increases so much that its annual growth rate exceeds that of the real GDP?
When the U.S. M2 annual growth exceeds annual real GDP growth, equities deliver much stronger returns. When GDP growth outpaces M2 growth, the stock S&P500 stagnates or declines. This shows that liquidity does not merely raise nominal stock market earnings or GDP; it reshapes the market’s willingness to pay for those earnings.
Jim Paulsen’s research captures this dynamic as he shows in this chart:
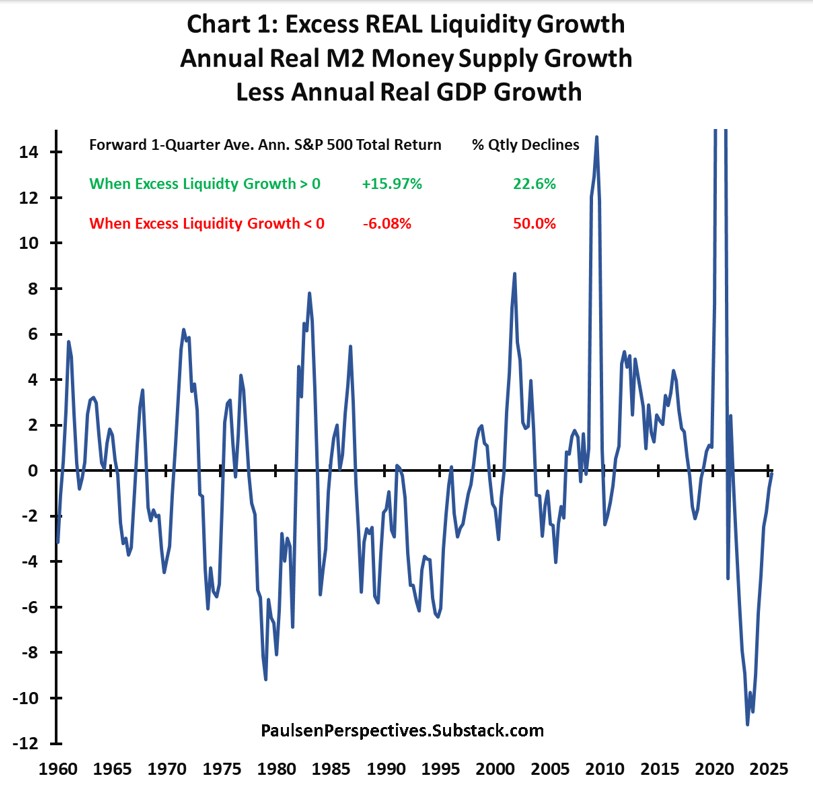
Illustration 3: Correlation between excess liquidity and the S&P500 performance.
I quote Jim Paulsen:
“[s]ince 1960, for all quarters when real excess annual liquidity growth was positive, the forward 1-quarter average annualized S&P 500 total return was a robust 15.97% compared to a forward 1-quarter average annualized S&P 500 loss of -6.08% for quarters when real excess liquidity was negative. Moreover, during quarters when excess liquidity was negative, the S&P 500 index suffered forward 1-quarter total return losses nearly 50% of the time compared to only 22.6% of the time when real excess liquidity was positive.”
As an aside, as of this writing (early September 2025), Jim Paulsen’s observation is bullish for the US stock market.
Historical Perspective: Liquidity Traps and Crashes
Market history shows that major financial crises, such as the Great Depression, the 2008 Global Financial Crisis, and the 2020 COVID-19 crash, were triggered or amplified by liquidity shortages. When liquidity dries up, credit channels seize, systemic risk skyrockets, and investors demand steep discounts for risk assets.
Conversely, periods of abundant liquidity not only support valuations but also act as a stabilizing force. In the post-2008 era, unprecedented central bank liquidity injections not only prevented systemic collapse but also ushered in a decade-long bull market. This underscores that liquidity doesn’t just follow market cycles; it shapes them.
But there’s a catch. Markets can become “hooked” on easy liquidity, making them vulnerable to sharp pullbacks if it suddenly dries up. That’s why timing indicators matter: they help us ride the wave when liquidity flows freely and protect us when the tide turns.
Rising Capital per Capita and the Decline in Natural Rates
While abundant liquidity helps push higher values, another crucial factor is the growth of capital per person.
As economies become wealthier, capital becomes more plentiful, leading to lower natural interest rates. By “natural” interest rate, I mean the interest rate free of inflation that would typically prevail in a given economy without central bank interference. The Austrian School of Economics has excellent insights into the natural rate of interest.
Interest is the cost of capital. If capital is scarce, the natural interest rate will rise. If it becomes abundant, like the price of everything, its rate will decline. This is why wealthy countries have lower interest rates than poorer countries. Lower interest rates result in higher valuations for stocks (PER).
A proxy for the capital stock per capita is GDP per capita, which I will use for the rest of this article.
I created the chart below that shows the relationship between GDP per capita and PER. I used the ETF representing each country as a proxy for its stock market. The x-axis displays GDP per capita, and the y-axis displays PER. The linear regression line clearly indicates that the higher the country’s GDP per capita, the higher the PER.
The correlation between a country’s wealth and its PER is noteworthy:
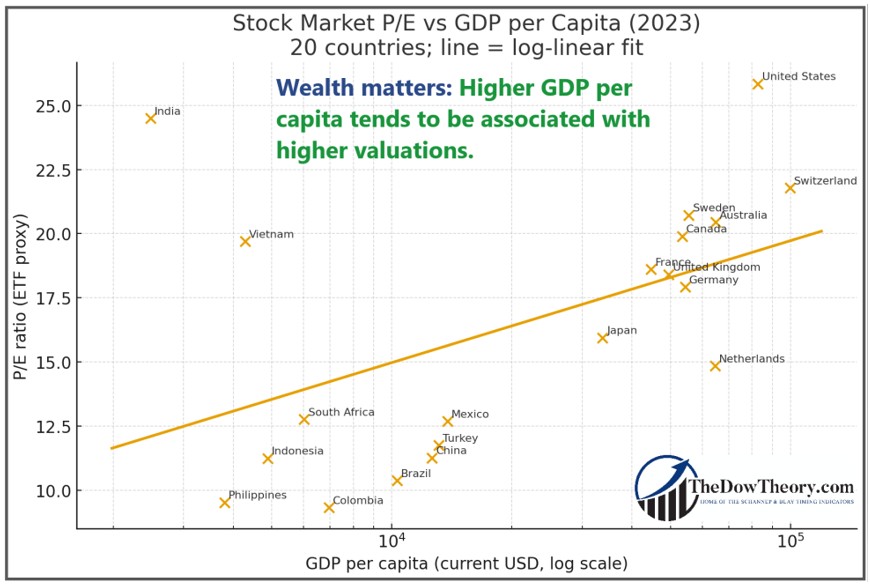
Illustration 4: Correlation Between Wealth per Capita in several countries and Valuation Multiples
The chart above has a Pearson correlation coefficient of 0.64, which is high, implying that a 2x richer country tends to have a 1.4 P/E points higher valuation (based on the fitted slope).
But things get even more interesting when we focus on the USA. The USA has continually grown richer in inflation-adjusted terms, which means a higher real GDP per capita.
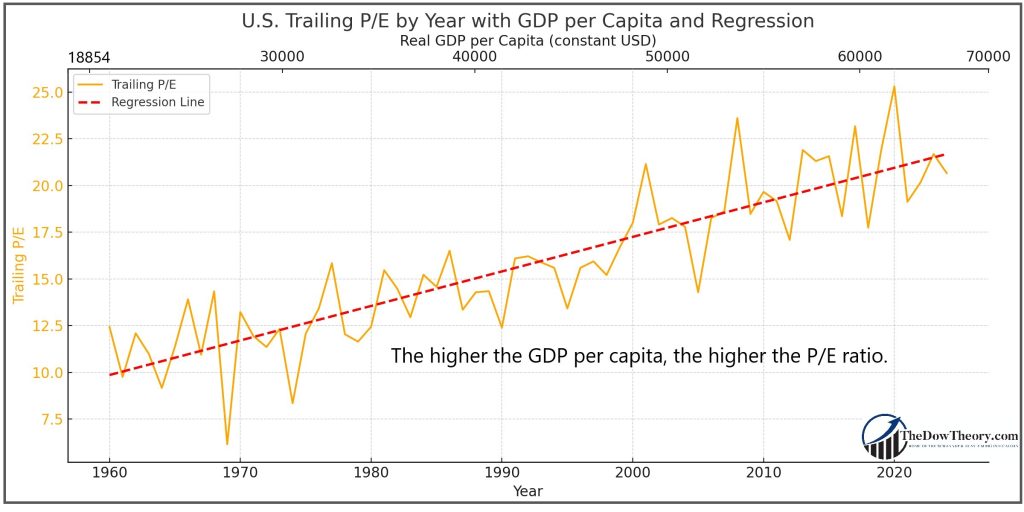
Illustration 5: Correlation Between US inflation-adjusted GDP per Capita and Valuation Multiples
Higher capital, measured by GDP per capita, also contributes to higher valuations in the USA. GDP inflation-adjusted has risen from the 1960s to today, as has the PER.
A lower natural interest rate resulting from increasing GDP directly boosts valuation multiples: when future earnings are discounted at a lower rate, their present value rises. Comparing current valuation levels to those of the 1970s or 1980s ignores this structural change. In a world with abundant capital, it is rational—not speculative—for investors to pay higher prices for each unit of earnings.
How much of the PER expansion is due to liquidity and how much to growing GDP per capita?
So far, we have examined how both liquidity and rising GDP per capita influence stock market valuations. An attentive reader might wonder whether we are conflating these two variables, as both affect the price-to-earnings (P/E) ratio. It is essential to separate and isolate the impact of each factor on P/E expansion.
Using AI, I conducted an in-depth analysis to separate the effects of liquidity growth from those of increasing GDP per capita. How much has each factor contributed to expanding PERs?
Since 1960, there has been a rise in the trailing P/E of about +12.7 points in total.
- Of that, roughly +4.1 points came from GDP per capita growth.
- Roughly +8.6 points came from more liquidity (real M2).
Therefore, for Trailing P/E, liquidity accounts for about twice as much of the increase as GDP does, but both are important.
Roughly, an increase of +1% in GDP per capita results in an increase of about +0.032 PER points.
And an increase of +1% in real M2 brings about a rise of +0.046 PER points.
Conclusion: Implications for Investors.
For investors, this analysis changes how valuations should be read. High P/E ratios or market cap to GDP levels are not automatic warning signs. They reflect powerful forces: abundant liquidity, low natural interest rates, reduced systemic risk, and a growing capital base. Valuations must be measured against these realities rather than clinging to outdated rules that label a P/E of 10 as cheap and 22 as expensive.
In this vein, just as a P/E ratio of 22 is often seen as expensive, many investors claim that another indicator points to extreme overvaluation: the Buffett Indicator, which compares the total stock market value to the country’s GDP. At first glance, its current reading (red line in the chart) appears extreme and seems to confirm that a crash is inevitable. That conclusion is wrong. Adjusting the Buffett Indicator for M2 gives a very different picture. The blue line at the bottom of the chart shows the ratio has hardly moved, from 0.13 in 1978 to 0.14 today.
During the dotcom bubble, the liquidity-adjusted indicator reached 0.296 in March 2000, more than twice today’s level. Seen through the lens of liquidity, current valuations are elevated but nowhere near the excesses of that era.
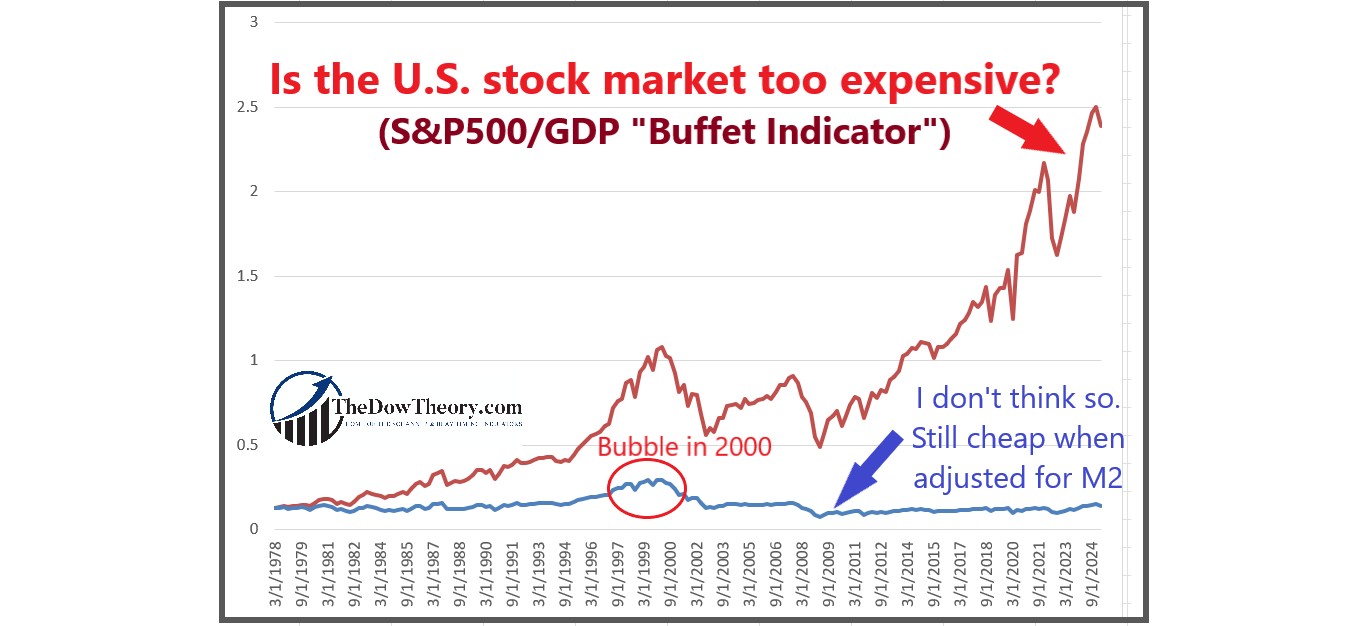
In today’s global economy—wealthier, more liquid, and better-capitalized than at any time in history—high valuations are not signs of irrational exuberance but reflections of structural forces that have permanently shifted the baseline for pricing risk.
However, should liquidity suddenly contract and/or GDP per capita shrink (due to misguided economic policies, war, etc.), then we should brace ourselves for a market crash, which is precisely what happened in the 1930s depression: Shrinking liquidity and real GDP. Market timing will be the lifeboat in such a case.
Sincerely,
Manuel Blay
Editor of thedowtheory.com


