Stocks Plunge but bull market unchanged, and precious metals in a Bear market now: Market Reactions to CPI Surprise
Overview: Yesterday (2/13/24) morning’s Consumer Price Index (CPI) inflation report surpassed expectations, triggering significant market upheaval. The Headline CPI saw a 0.3% month-over-month increase compared to the previous month’s 0.2% rise. This unexpected development led to widespread turmoil: stocks plummeted, precious metals and their mining stocks declined, and U.S. treasuries experienced substantial drops amid concerns over higher inflation and the likelihood of delayed interest rate cuts.
In my post dated 2/2/24, titled “TLT and IEF Watch: Are Bonds on the Brink of a Primary Bear Market Signal?” I accurately predicted a potential shift to a bearish trend in bonds. As is often the case, price movements tend to precede news.
This post delves into the action of U.S. treasuries, as represented by the TLT and IEF ETFs. Unlike US stocks, the 2/13/24 drop ushered U.S. bonds into a new bear market. For the U.S. stock market, and notwithstanding the most recent drop, the primary and secondary trend is bullish. You can read the most recent Dow Theory trend appraisal for the U.S. stocks in my post “Critical Stock Market Update: The classical Dow Theory signaled a bull market on 2/8/24“.
As an aside, the Dow Theory for the 21st Century signaled a BUY much earlier, capturing substantial gains along the way. You can read more about the net superiority of the DT21C vs. the Dow Theory in this article.
Stay tuned for another post, in which I will discuss the situation in the gold and silver markets, both of which also turned bearish on 2/13/24.
General Remarks:
In this post, I extensively elaborate on the rationale behind employing two alternative definitions to evaluate secondary reactions.
TLT refers to the iShares 20+ Year Treasury Bond ETF. You can find more information about it here
IEF refers to the iShares 7-10 Year Treasury Bond ETF. You can find more information about it here.
TLT tracks longer-term US bonds, while IEF tracks intermediate-term US bonds. A bull market in bonds signifies lower interest rates, whereas a bear market in bonds indicates higher interest rates.
A) Market situation if one appraises secondary reactions not bound by the three weeks and 1/3 retracement dogma.
As I explained in this post, the primary trend was signaled as bullish on 12/13/23.
Following a pullback (secondary reaction against the bullish trend), both TLT and IEF experienced a bounce, setting up both ETFs for a potential primary bear market. You can find detailed explanations and charts here.
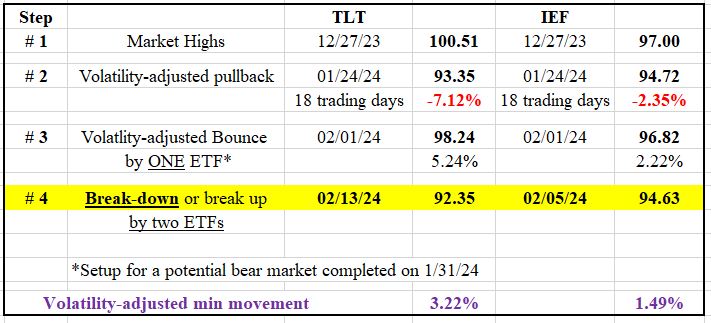
The table below furnishes relevant information:

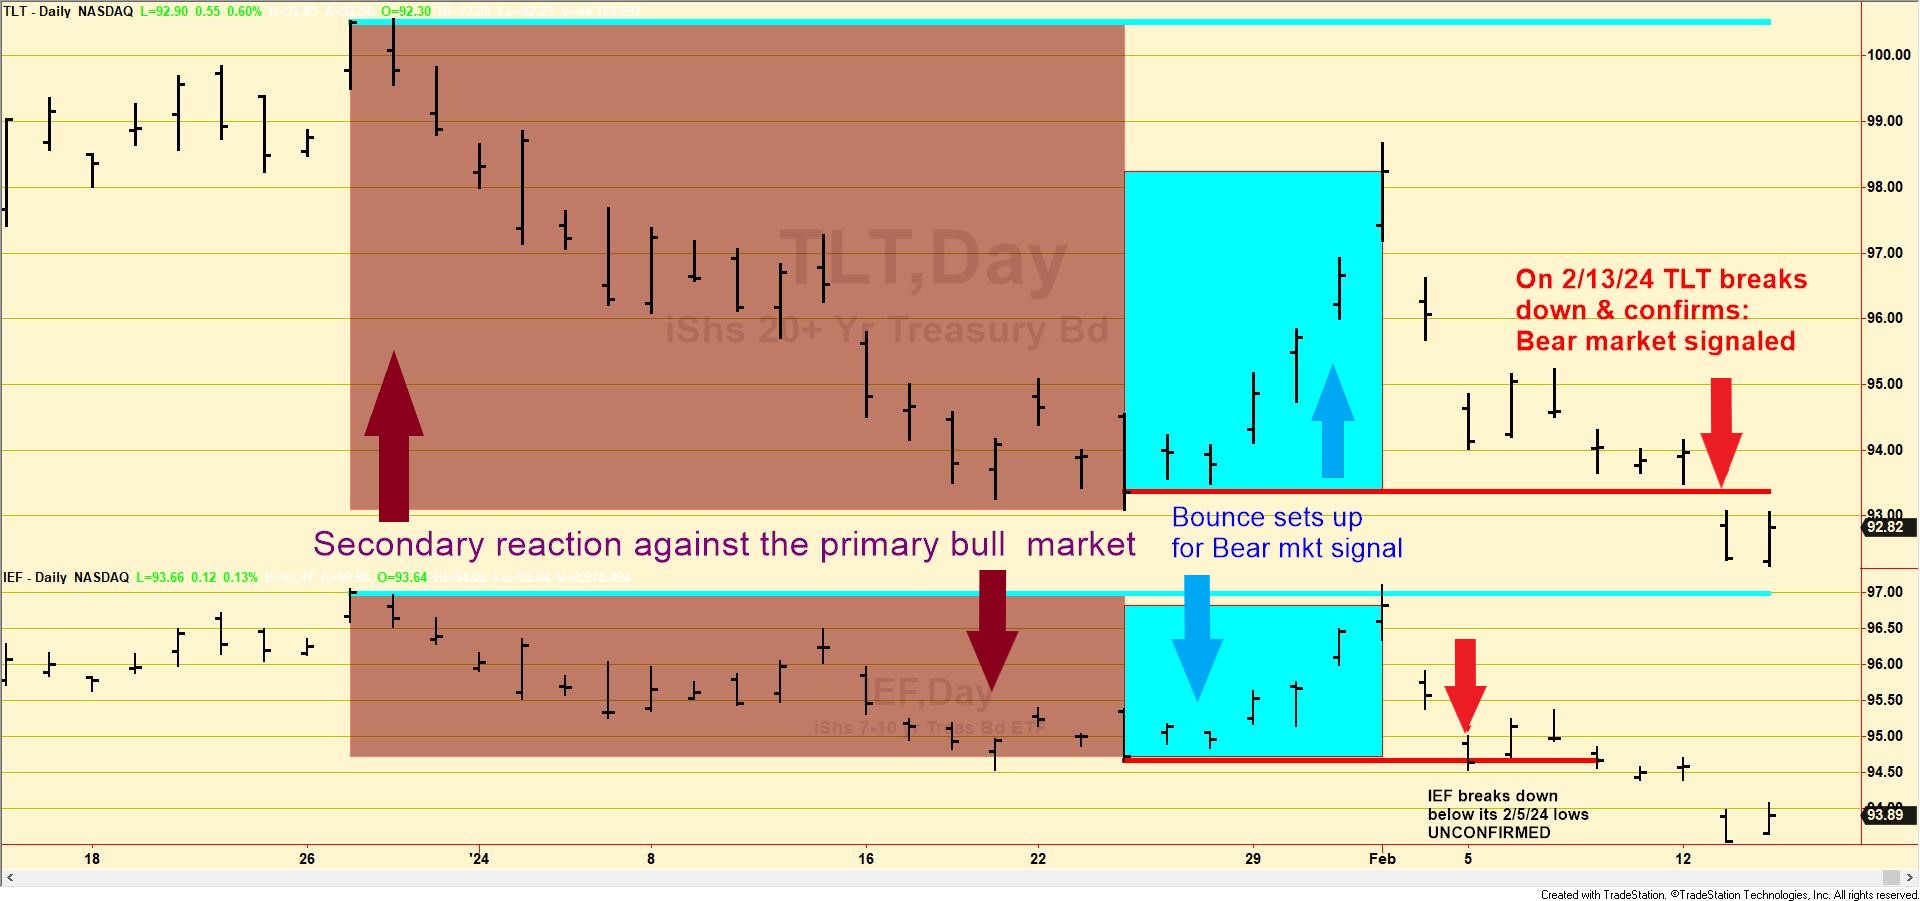
On February 5th, 2024, IEF broke below its January 24th, 2024 closing lows (Step #2) without confirmation from TLT. However, on February 13th, 2024, TLT breached these lows, confirming the breakdown and thus signaling a new primary bear market according to the Dow Theory.
Check out the chart below for a visual walkthrough of the recent price action. The brown rectangles highlight the secondary reaction (Step #2), the blue rectangles showcase the rally (Step #3) originating from the secondary reaction lows that set up both ETFs for a potential bear market signal, and the red horizontal lines pinpoint the pullback lows whose joint violation signaled the new “bear market.” The blue horizontal lines highlight the last recorded primary bull market highs (Step #1) whose breakup would signal a new primary bull market.

Thus, both the primary and secondary trends are currently bearish.
B) Market situation if one sticks to the traditional interpretation demanding more than three weeks and 1/3 confirmed retracement to declare a secondary reaction.
As detailed in this post, the primary trend was signaled as bullish on 12/13/23.
In this specific instance, the price action explained above fully applies to the “longer-term” rendering of the Dow Theory. In other words, look at the table and charts above, as they fully explain what happened when we take a longer view. Therefore, the primary and the secondary trend are bearish.
Sincerely,
Manuel Blay
Editor of thedowtheory.com


