Not yet, but the setup for a potential bear market signal in US bonds has been completed.
General Remarks:
In this post, I thoroughly explained the rationale behind using two alternative definitions to appraise secondary reactions.
TLT is the iShares 20 years + Treasury bond ETF. More about it here
IEF is the iShares 7-10 years Treasury bond ETF. More about it here.
Thus, TLT tracks longer-term US bonds, whereas IEF tracks middle-term US bonds. A bull market in bonds entails lower interest rates. A bear market in bonds represents higher interest rates.
A) Market situation if one appraises secondary reactions not bound by the three weeks and 1/3 retracement dogma.
As I explained in this post, the primary trend was signaled as bullish on 12/13/23.
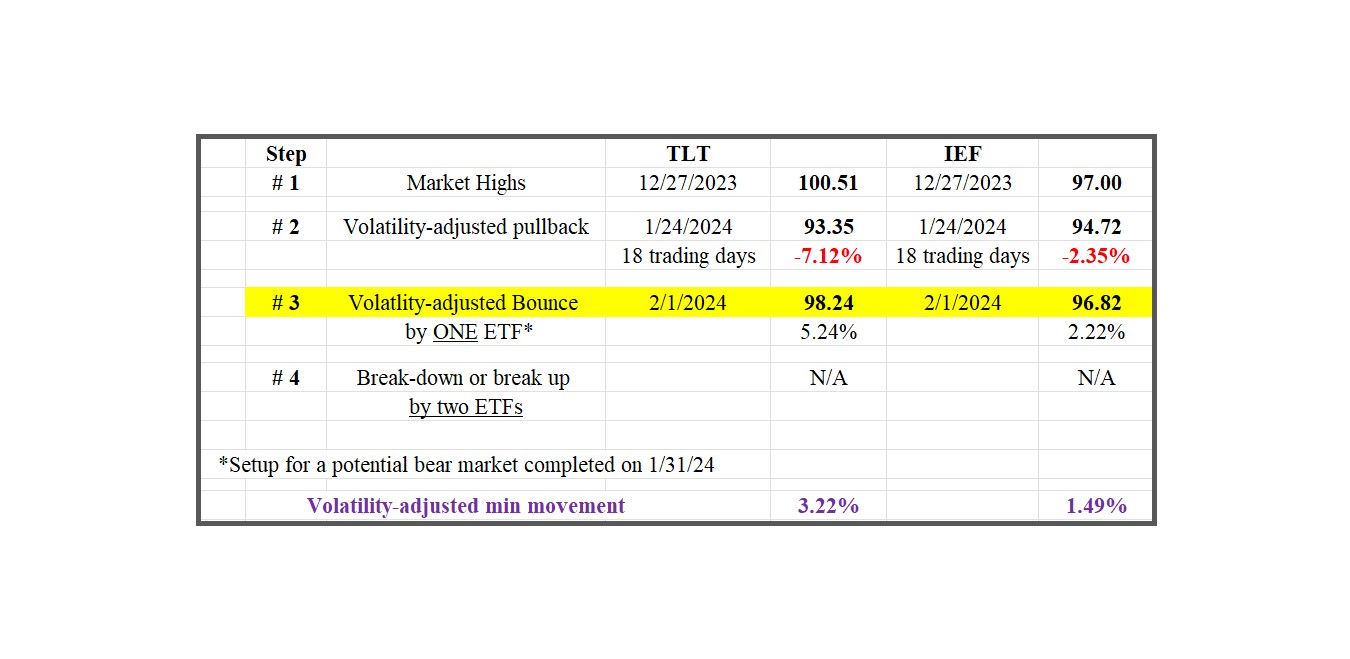
Following the 12/27/23 highs, the market experienced a pullback lasting 18 trading days, concluding on 1/24/24. This pullback met the time and extent requirements for a secondary (bearish) reaction against the primary bullish trend. The subsequent rally, kickstarting from the 1/24/24 lows, gained enough extent by 1/31/24 to set up TLT and IEF for a potential primary bear market signal. This rally persisted until 2/1/24, marking a crucial juncture.
The Table below shows the details:
Therefore, the primary is bullish and the secondary trend is bullish.
So, now we have the following scenarios:
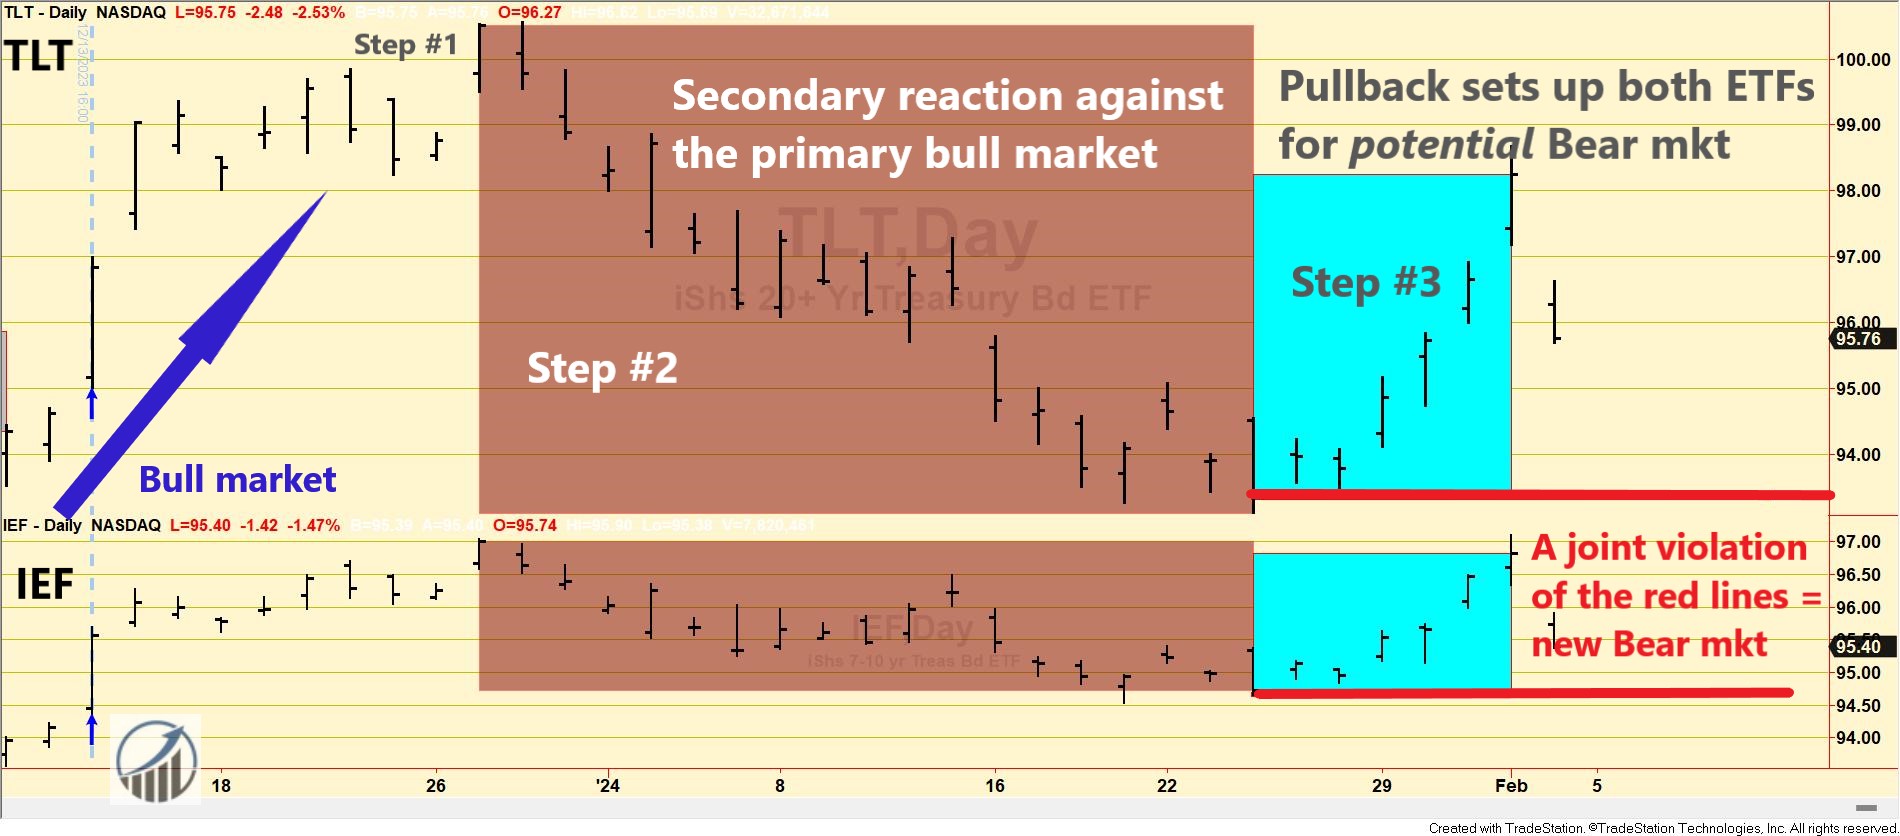
a) If TLT and IEF jointly breach the 1/24/24 closing lows (refer to Step #2 in the table above), it would signify the onset of a primary bear market.
b) On the flip side, if TLT and IEF resume their recent rally and jointly surpass their 12/27/23 closing highs, it would confirm the continuation of the primary bull market, rendering the secondary reaction null and void.
Check out the chart below for a visual walkthrough of the recent price action. The brown rectangles highlight the secondary reaction (Step #2), the blue rectangles showcase the rally (Step #3) originating from the secondary reaction lows, and the red horizontal lines pinpoint the pullback lows whose joint violation would scream “bear market.”

As highlighted in previous discussions (HERE and HERE), the Dow Theory accurately tracked the now recently terminated bear market, shielding those who followed its cues from losses or even raking in profits for those who shorted.
B) Market situation if one sticks to the traditional interpretation demanding more than three weeks and 1/3 confirmed retracement to declare a secondary reaction.
As I explained in this post, the primary trend was signaled as bullish on 12/13/23.
In this specific instance, the price action that was explained above fully applies to the “longer-term” rendering of the Dow Theory. In other words, look at the table and charts above, as they fully explain what happened when we take a longer view. Therefore, the primary is bullish, and the secondary trend is bullish.
Sincerely,
Manuel Blay
Editor of thedowtheory.com


