Powell’s Hawkish Tone Triggers Major Shifts in TLT and IEF
Overview: All markets, notably bonds, reacted negatively to Powell’s more hawkish stance, as investors had anticipated more substantial and frequent rate cuts. The big drop TLT and IEF experienced on 12/18/24 triggered a primary bear market signal.
Later today, or tomorrow, I will write about the bear market signal triggered also on 12/18/24 for the gold and silver miners ETFs (GDX & SIL).
General Remarks:
In this post, I extensively elaborate on the rationale behind employing two alternative definitions to evaluate secondary reactions.
TLT refers to the iShares 20+ Year Treasury Bond ETF. You can find more information about it here
IEF refers to the iShares 7-10 Year Treasury Bond ETF. You can find more information about it here.
TLT tracks longer-term US bonds, while IEF tracks intermediate-term US bonds. A bull market in bonds signifies lower interest rates, whereas a bear market in bonds indicates higher interest rates.
A) Market situation if one appraises secondary reactions not bound by the three weeks and 1/3 retracement dogma
As I explained in this post, the primary trend shifted to bullish on 6/4/24.
My 11/29/24 post started to sound the alarms concerning a possible bear market signal on the horizon.
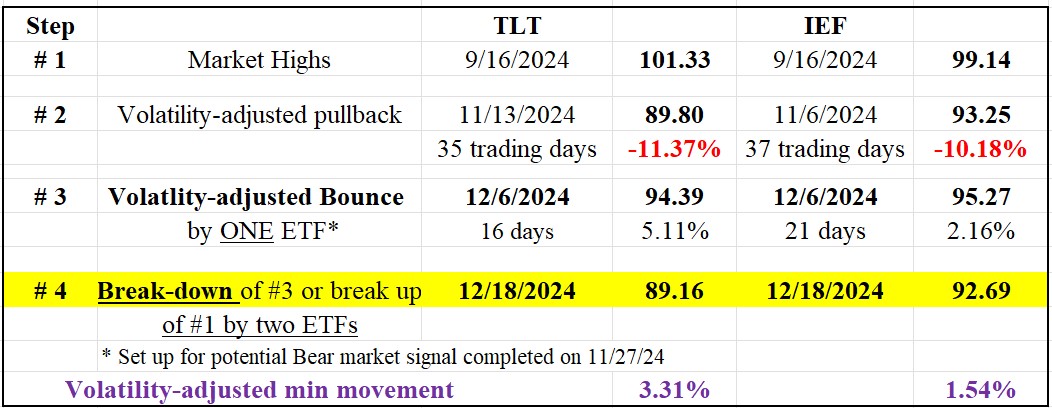
On 12/18/24, TLT and IEF jointly pierced their respective secondary reaction lows (11/13/24 for TLT and 11/6/24 for IEF), as shown in Step #2 in the table below. Such a confirmed breakdown shifted the trend from bullish to bearish.

So, the primary and secondary trends are bearish now.
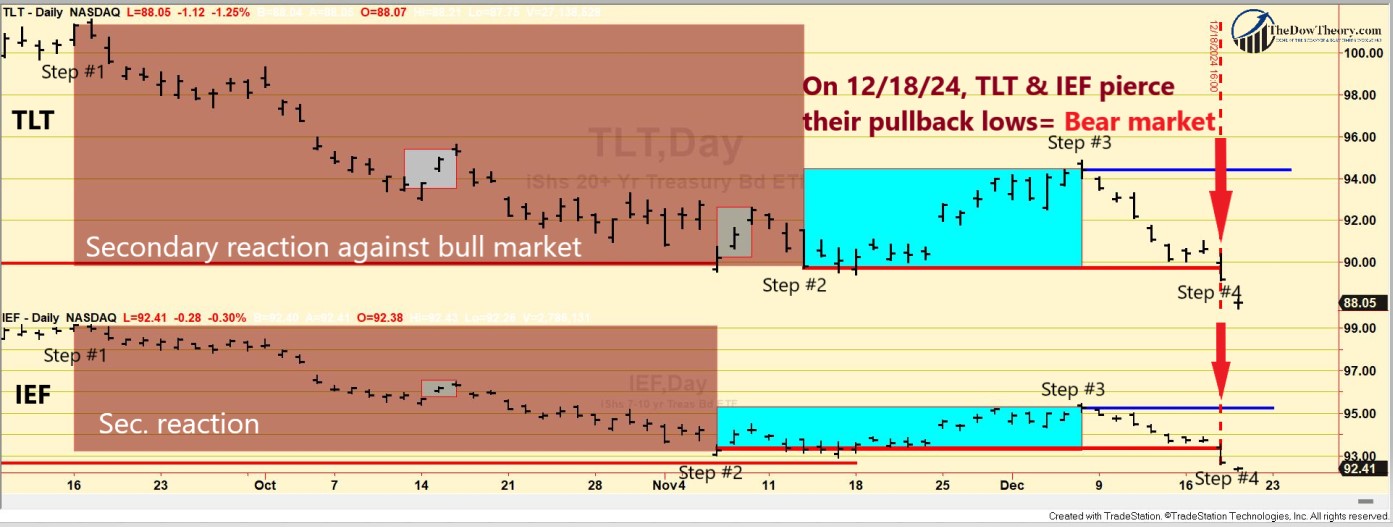
The following charts depict the latest price movements. Brown rectangles indicate the secondary (bearish) reaction opposing the ongoing primary bull market. Blue rectangles highlight the recent rally that fulfilled the setup for a potential primary bear market (Step #3). Red horizontal lines mark the secondary reaction lows (Step #2). The blue horizontal lines show the bounce highs (Step #3), which independently also satisfy the time and extent requirement for a secondary reaction. A breach of these peaks would signal a new primary bull market, though this scenario appears unlikely in the near term.

So, the situation is as follows: At the current juncture, a breakup on a closing basis by both TLT and IEF of the 12/6/24 closing highs (Step #3) would signal a new bull market. Until this breakup occurs, we consider bonds in a bear market.
B) Market situation if one sticks to the traditional interpretation demanding more than three weeks and 1/3 confirmed retracement to declare a secondary reaction.
As I explained in this post, the primary trend was signaled as bullish on 7/31/24.
My 11/29/24 post started to sound the alarms concerning a possible bear market signal on the horizon.
In this instance, the long-term application of the Dow Theory coincides with the shorter-term version, so a primary bear market signal has been triggered on 12/18/24.
Sincerely,
Manuel Blay
Editor of thedowtheory.com


