US Bonds Turn Bullish: What’s Next for the Economy?
Overview: When appraised by the more reactive application of the Dow Theory, the trend of US bonds turned bullish on 6/4/24. The question is: Is the bond market discounting a recession or merely a soft landing resulting in lower inflation? The unemployment rate for May, to be published on 6/7/24, will probably give us more clues, as well as oil, if it maintains its bearish trend.
General Remarks:
In this post, I extensively elaborate on the rationale behind employing two alternative definitions to evaluate secondary reactions.
TLT refers to the iShares 20+ Year Treasury Bond ETF. You can find more information about it here
IEF refers to the iShares 7-10 Year Treasury Bond ETF. You can find more information about it here.
TLT tracks longer-term US bonds, while IEF tracks intermediate-term US bonds. A bull market in bonds signifies lower interest rates, whereas a bear market in bonds indicates higher interest rates.
A) Market situation if one appraises secondary reactions not bound by the three weeks and 1/3 retracement dogma
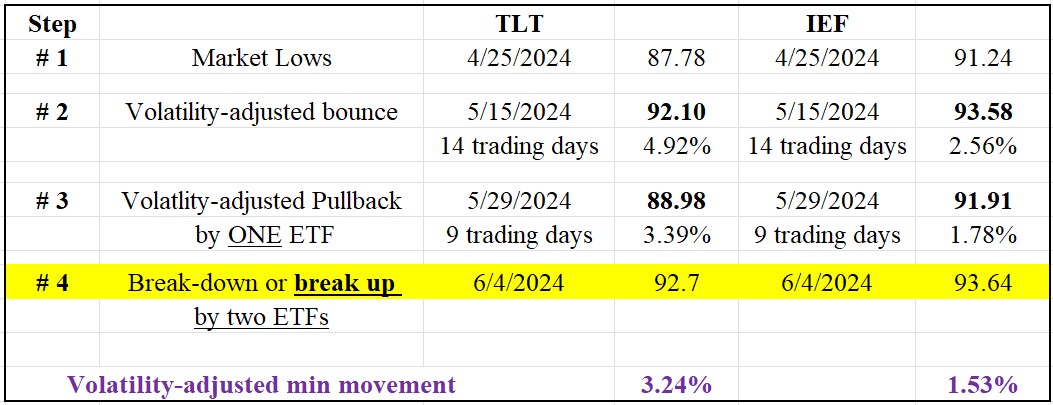
The primary trend shifted to bullish on 6/4/24 when TLT and IEF jointly surpassed their 5/15/24 closing highs.
You may read more about the setup that preceded the new primary bull market signal in my 6/3/24 post.
The table below displays the price action that led to the new bull market signal.
So, now the primary and secondary trends are bullish.
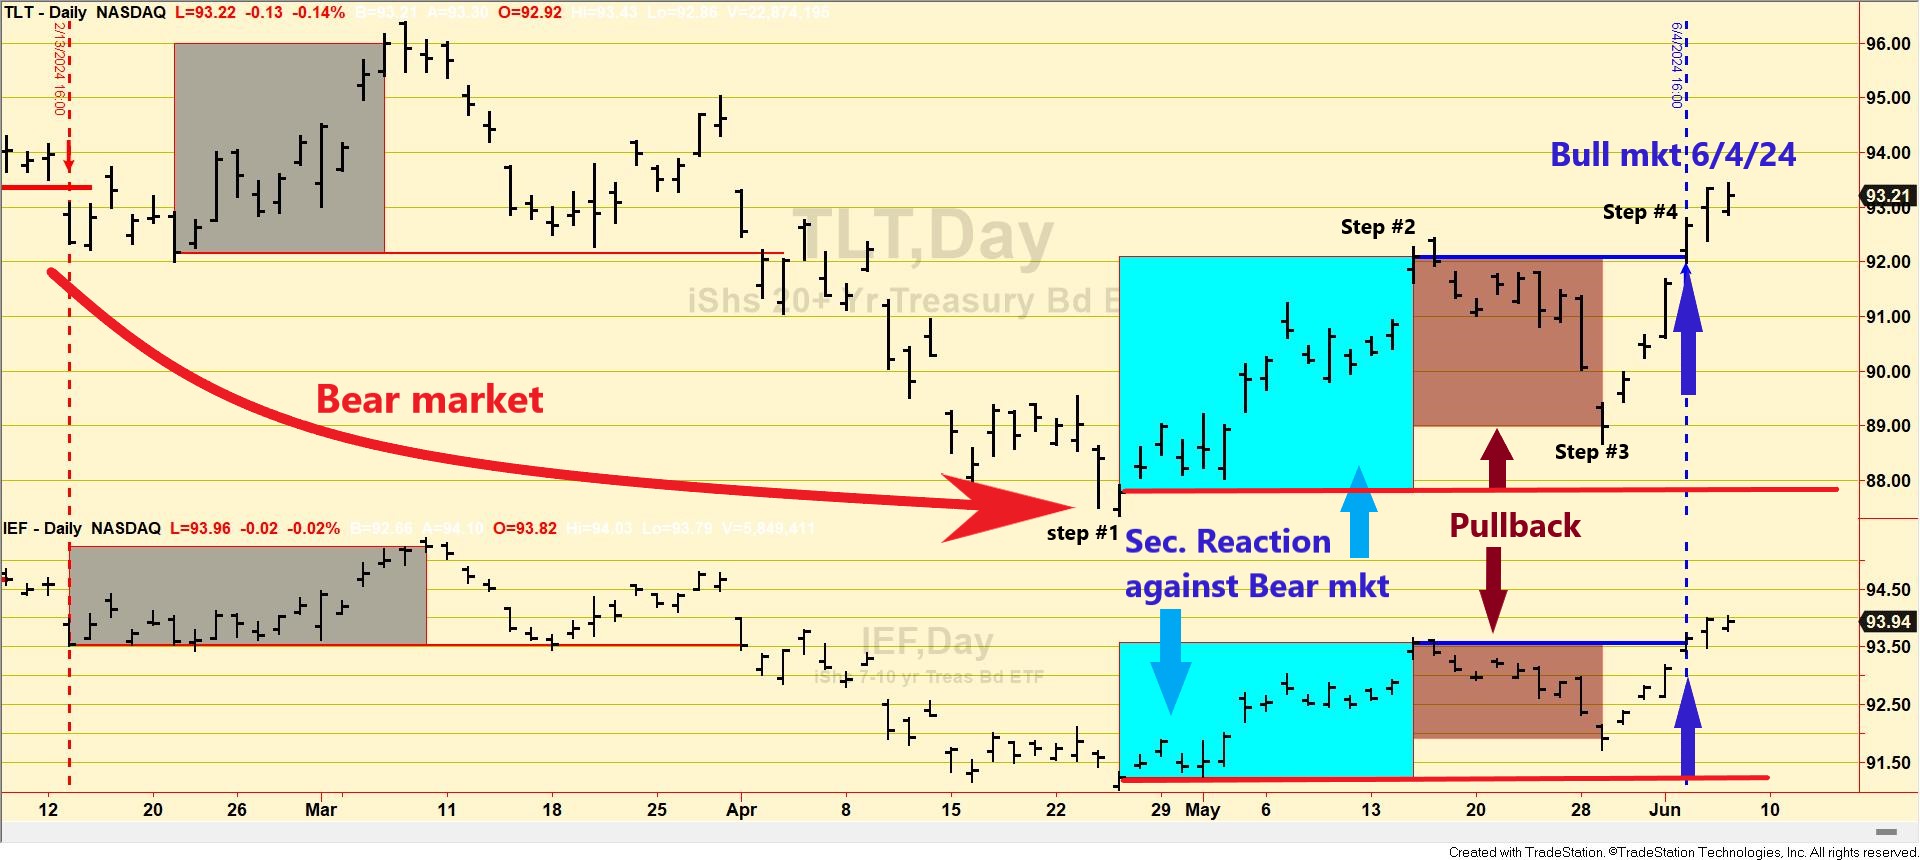
The charts below depict the current market situation. The grey rectangles on the left show a rally that occurred in March that did not qualify as a secondary reaction. The blue rectangles (Step #2) highlight the current secondary (bearish) reaction against the primary bear market. The brown rectangles show the most recent pullback that set up both ETFs for a potential primary bull market signal. The blue horizontal lines highlight the bounce highs (step #2), whose breakup signaled the new bull market. The red horizontal lines highlight the primary bear market lows whose breakdown would signal a new primary bear market.
B) Market situation if one sticks to the traditional interpretation demanding more than three weeks and 1/3 confirmed retracement to declare a secondary reaction.
As detailed in this post, the primary trend was signaled as bearish on 2/13/24.
TLT and IEF drifted downward until 4/25/24 (Step #1 in the table below). From these lows, a bounce lasting 28 trading days followed until 6/5/24 (Step #2). The table below shows that the rally met the time and extent requirements for a secondary (bullish) reaction against the primary bearish trend. Now, we wait for a >=3% pullback to complete the setup for a potential primary bull market signal.
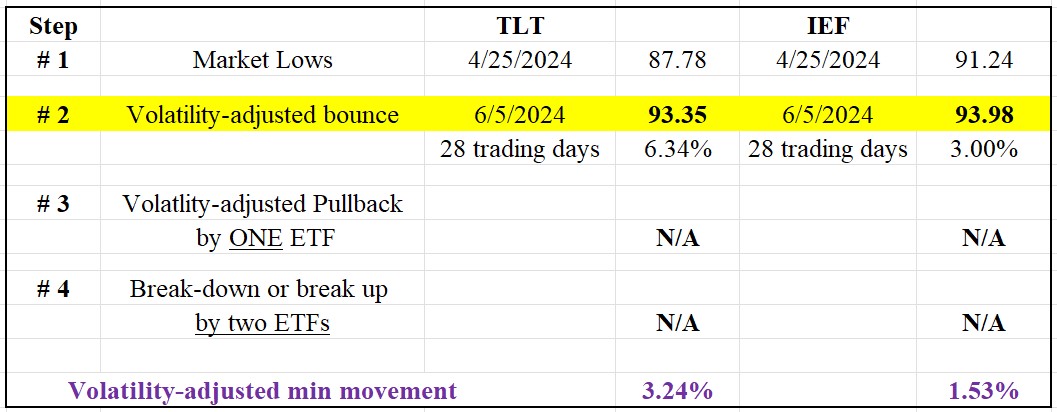
The charts below depict the current situation. The blue rectangles highlight the present secondary (bullish) reaction against the primary bear market.
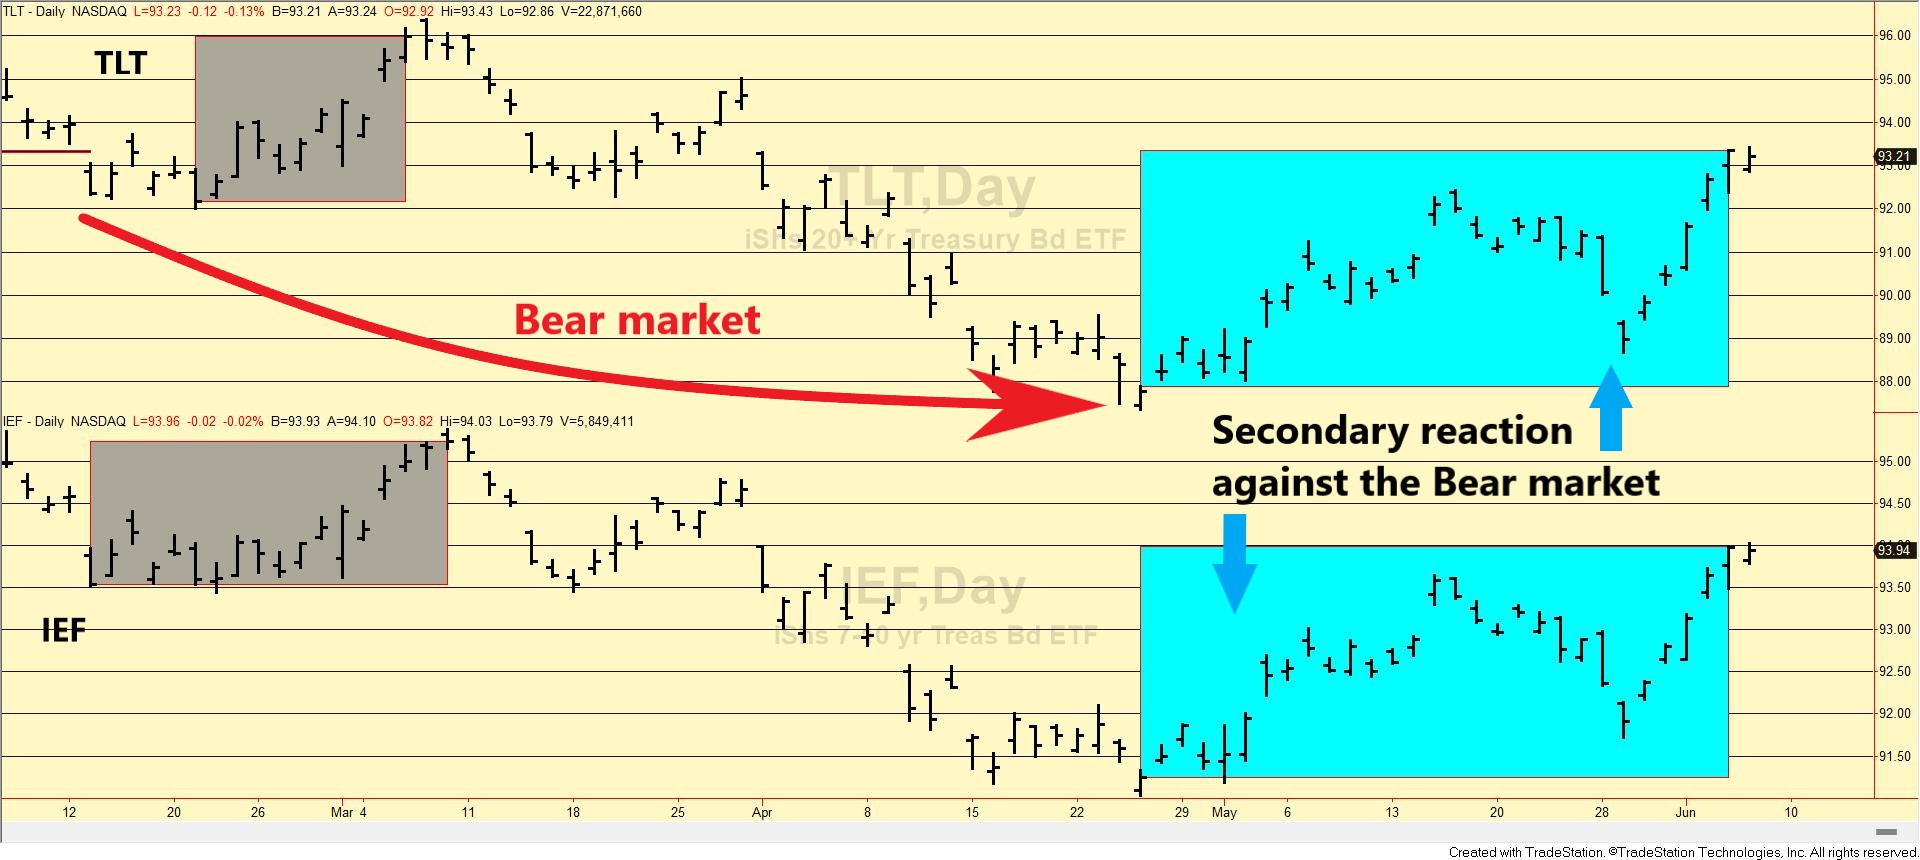
Therefore, the primary trend is bearish and the second one is bullish.
Sincerely,
Manuel Blay
Editor of thedowtheory.com


