

The bear market in bonds continues
General Remarks:
In this post, I thoroughly explained the rationale behind my use of two alternative definitions to appraise secondary reactions.
TLT is the iShares 20 plus Years Treasury Bond ETF. More about it here.
IEF is the iShares 7 to 10 Years Treasury Bond ETF. More about it here.
Thus, TLT tracks longer term US bonds, whereas IEF tracks middle term US bonds. A bull market in bonds entails lower interest rates. A bear market in bonds represents higher interest rates.
A) Market situation if one appraises secondary reactions not bound by the three weeks and 1/3 retracement dogma.
As I explained HERE, the primary trend was signaled as bearish on 5/19/2026. Following the 5/19/2026 bear market lows, a rally ensued, qualifying as a secondary (bullish) reaction against the primary bear market. The secondary reaction itself was signaled on 6/24/2026, and the volatility-adjusted bounce was completed on 6/29/2026, 27 trading days off the lows. Finally, a pullback on 7/13/2026 set up TLT and IEF for a potential primary bull market.
After the pullback, both ETFs headed lower over the following weeks. On 7/22/2026, IEF penetrated its 5/19/2026 primary bear market lows. On 7/29/2026, TLT broke down below its 5/19/2026 lows, providing confirmation. The Table below shows you the details:
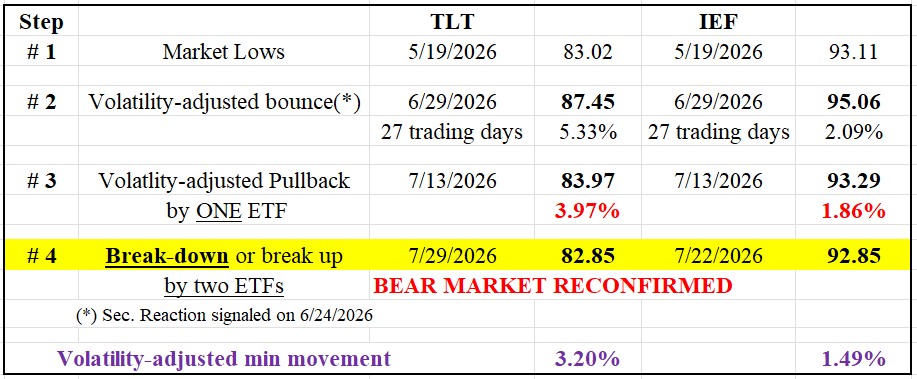
So, the implications of the newer lows are as follows:
1) The secondary reaction against the primary bear market has been terminated. Now the secondary trend is also bearish.
2) The setup for a potential primary bull market has been canceled.
3) The primary bear market signaled on 5/19/2026 has been reaffirmed.
The charts provide a visual representation of price action in the market over the past few months, spanning from the lows observed on 5/19/2026 to the present day. The blue rectangles will indicate the secondary (bullish) reaction against the primary bear market. The dark blue rectangles represent the pullback that set up both ETFs for a potential primary bull market. The red horizontal lines will highlight the primary bear market lows of 5/19/2026, which have recently been pierced.
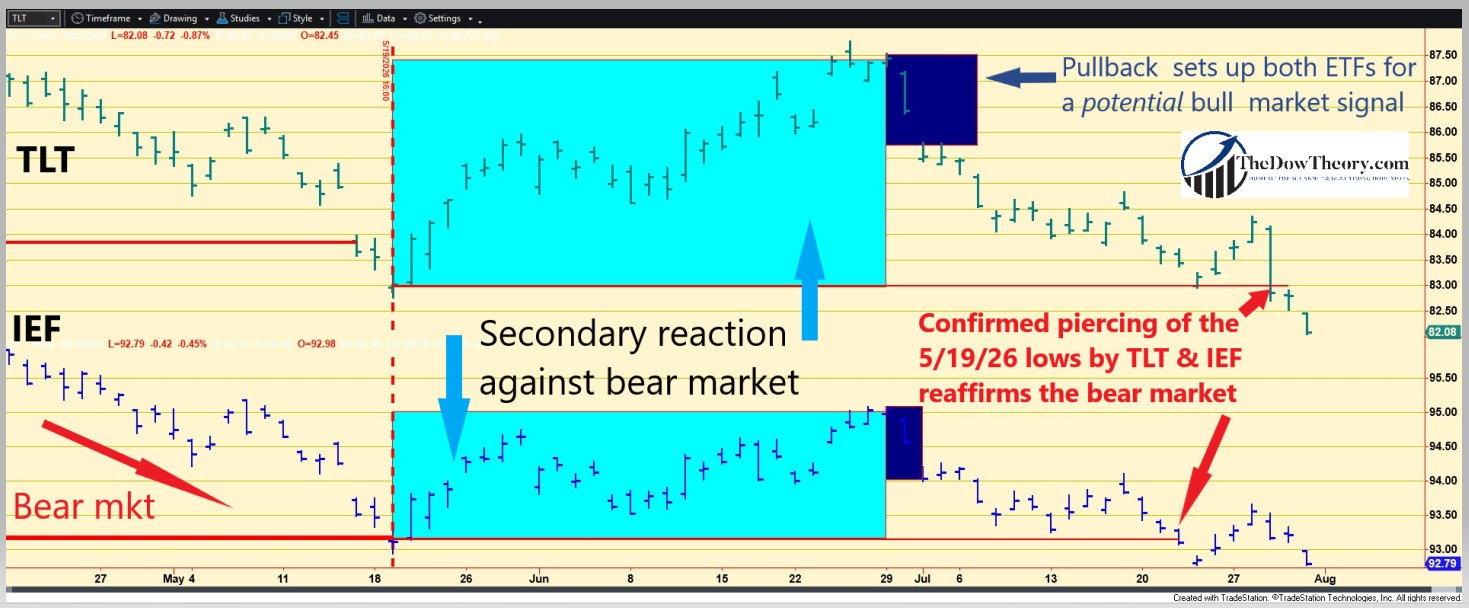
Therefore, it appears that the bond market continues to price in persistent inflationary pressure rather than the likelihood of an imminent recession. It is not necessarily a harbinger of a bear market in equities, but it may continue to limit their upside.
B) Market situation if one sticks to the traditional interpretation demanding more than three weeks and 1/3 confirmed retracement to declare a secondary reaction.
In this specific instance, the longer-term application of the Dow Theory aligns with the shorter-term rendering explained above. In other words, the price action and the Table shown above fully apply when we take the longer term view as well. Therefore, the primary trend shifted to bearish on 5/19/2026, and both the primary and secondary trends are bearish under this interpretation too.
Sincerely,
Manuel Blay
Editor of thedowtheory.com