The primary trend remains bullish until proven otherwise
Overview: GDX and Sil underwent a secondary reaction against the primary bull market. The recent price action resulted in a setup for a potential bear market signal being completed. Please mind the word “potential”, which implies that the primary bull market remains in force.
GDX broke up high but SIL’s weakness negated confirmation, and, thus, the bull market has not been confirmed.
Gold and Silver are in a bull market of their own, as I explained HERE.
General Remarks:
In this post, I extensively elaborate on the rationale behind employing two alternative definitions to evaluate secondary reactions.
SIL refers to the Silver Miners ETF. More information about SIL can be found HERE.
GDX refers to the Gold Miners ETF. More information about GDX can be found HERE.
A) Market situation if one appraises secondary reactions not bound by the three weeks and 1/3 retracement dogma.
As I explained in this post, the primary trend was signaled as bullish on 4/3/24.
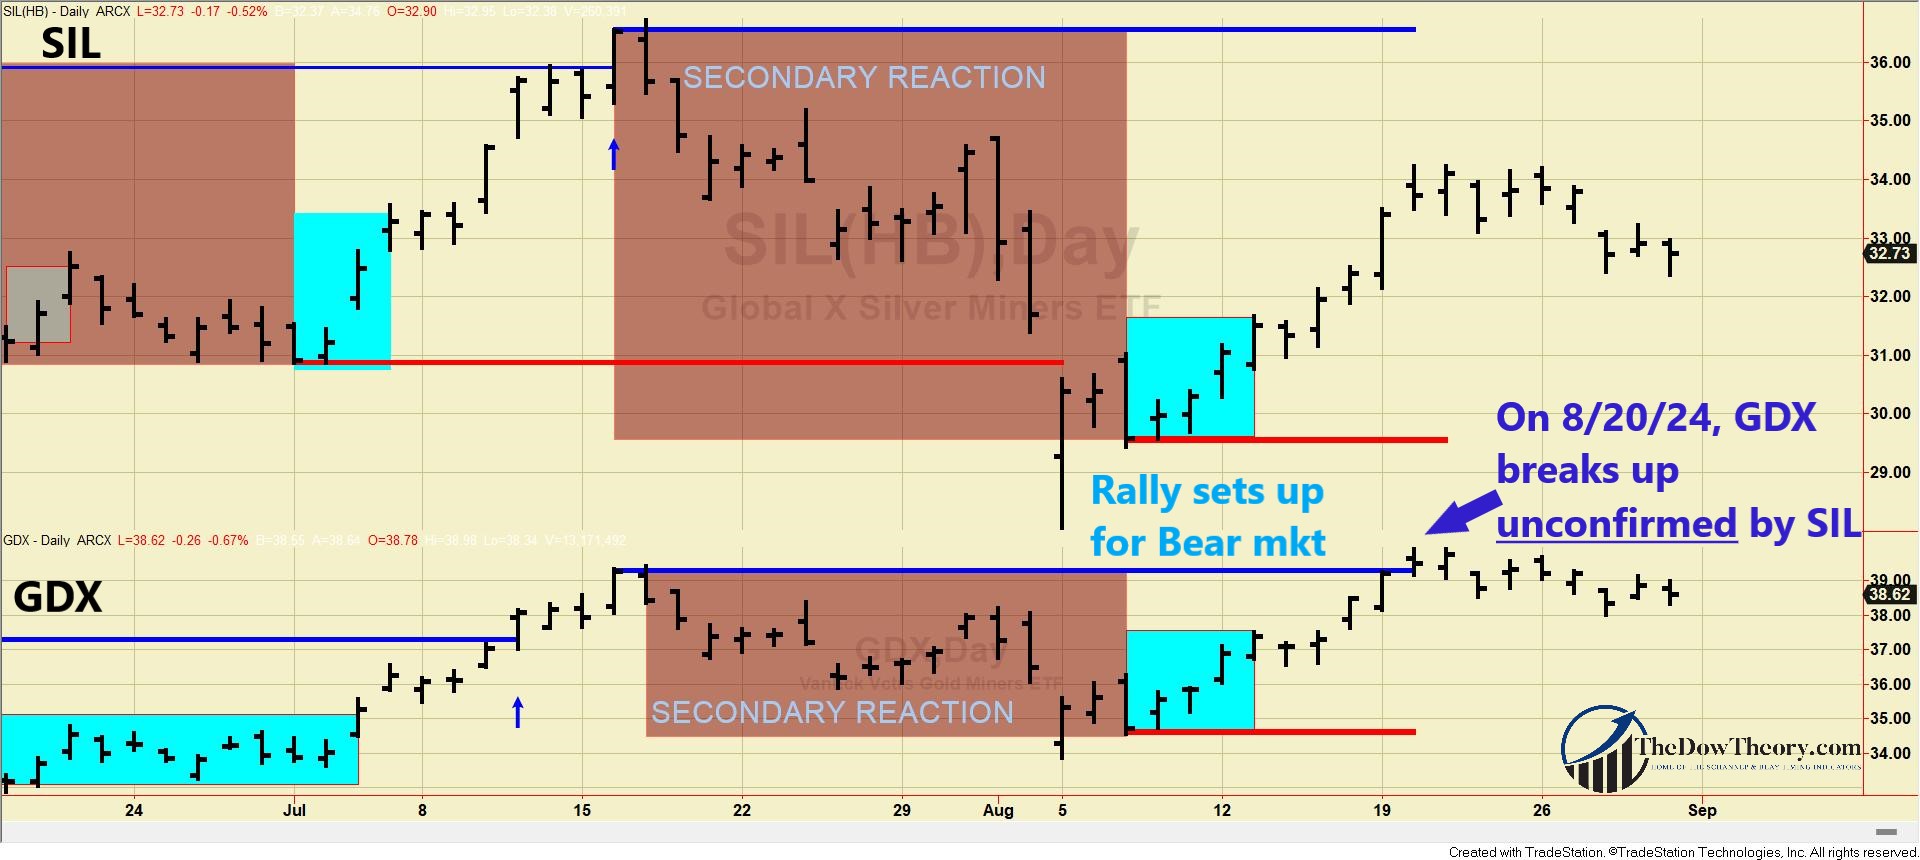
On 8/5/24, SIL broke down its 7/1/24 lows unconfirmed by GDX, so the primary bullish trend has not been changed.
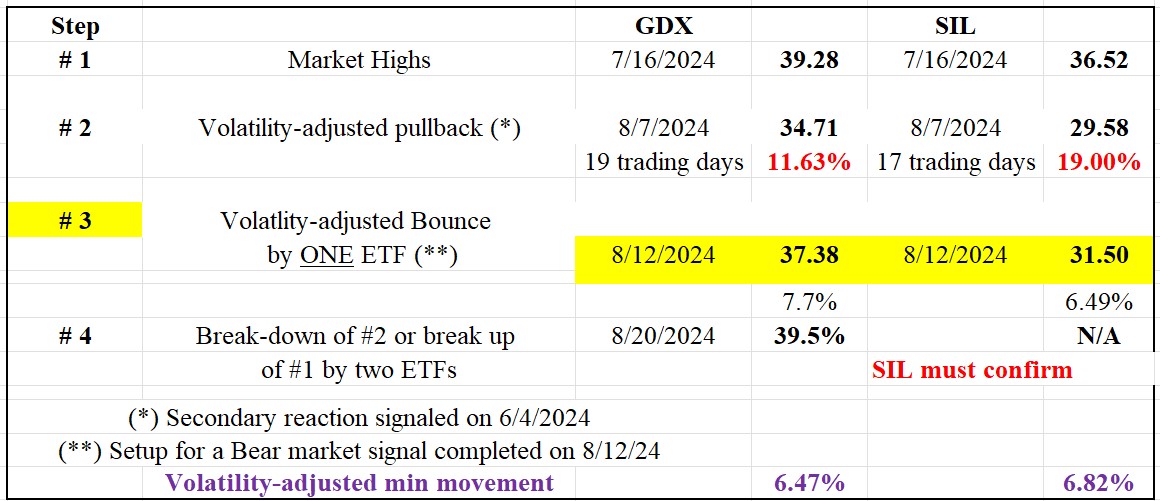
The rally that started off the 8/7/24 lows set up both ETFs for a potential primary bear market signal. Thus, a confirmed breakdown of the 8/7/24 closing lows at 29.58 (SIL) and 34.71 (GDX) would signal a new primary bear market.
The table below gives you the most relevant information:

So, now there are two options:
- If SIL and GDX surpass their 7/16/24 highs on a closing basis (Step #1 in the above table), the secondary reaction and setup for a potential bear market signal will be canceled. On 8/20/24, GDX surpassed its 7/16/24 highs unconfirmed by SIL. So, the technical situation has not changed.
- A primary bull market will be signaled if SIL and GDX break down below their 8/7/24 lows.
The charts below illustrate recent price movements. The brown rectangles highlight the secondary reaction within the primary bear market. The small blue rectangles on the right show the initial days of a rally that set up both ETFs for a potential primary bear market signal. The blue horizontal lines indicate the last recorded primary bull market highs that must be surpassed to reconfirm the bull market (Step #1). The red horizontal lines highlight the 8/7/24 lows (Step #2).

As of this writing, the primary trend is bullish, and the secondary one is bearish.
B) Market situation if one sticks to the traditional interpretation demanding more than three weeks and 1/3 confirmed retracement to declare a secondary reaction.
In this post, I explained that the primary trend was signaled as bullish on 4/3/24.
In this instance, the long-term application of the Dow Theory coincides with the shorter-term version, so there was a secondary reaction against the primary bull market and the setup for a potential bear market signal has been completed.
As of this writing, the primary trend is bullish, and the secondary one is bearish.
Sincerely,
Manuel Blay
Editor of thedowtheory.com


