Once hesitation is over, the next move can be explosive.
Overview: The bond market is really at a crossroads. Depending on the timeframe applied, we got two contradictory potential signals. The shorter-term application of the Dow Theory, which I favor in cases like this as it is more reactive, completed the setup for a potential bear market, while the long-term one resulted in just the opposite: a setup for a potential bull market.
Such a gross divergence between the two timeframes is infrequent. When it occurs, it shows a market lacking direction. When the bond market finally makes its mind up, the final move can be explosive.
Fundamentally, the bond market is caught between two contradictory forces: deflation and a likely recession and the underlying inflationary pressures, which, notwithstanding the most rcent CPI print, have not subsided yet, as evidenced by a rising Producer Price Index.
So, let’s get started with the Dow Theory analysis.
General Remarks:
In this post, I extensively elaborate on the rationale behind employing two alternative definitions to evaluate secondary reactions.
TLT refers to the iShares 20+ Year Treasury Bond ETF. You can find more information about it here
IEF refers to the iShares 7-10 Year Treasury Bond ETF. You can find more information about it here.
TLT tracks longer-term US bonds, while IEF tracks intermediate-term US bonds. A bull market in bonds signifies lower interest rates, whereas a bear market in bonds indicates higher interest rates.
A) Market situation if one appraises secondary reactions not bound by the three weeks and 1/3 retracement dogma
As I explained in this post, the primary trend shifted to bullish on 6/4/24.
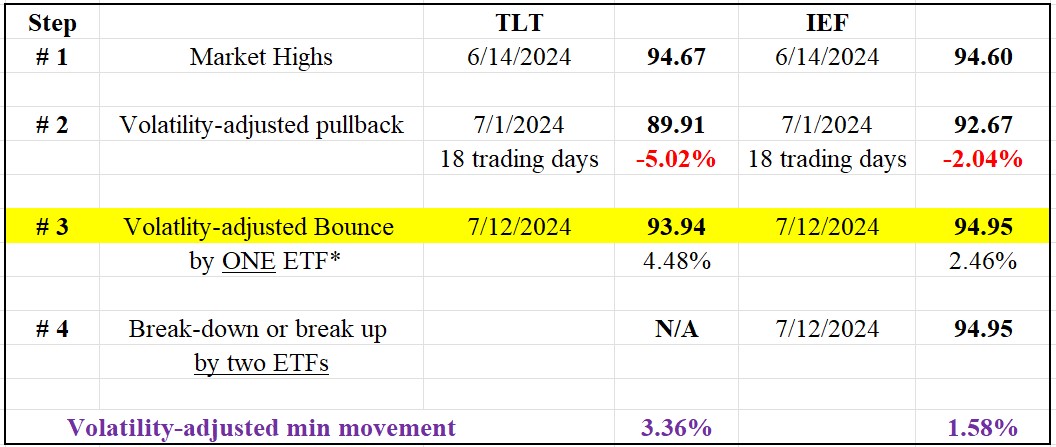
On 7/1/24, a secondary (bearish reaction) against the primary bull market was signaled. From its 6/14/24 closing highs, TLT and IEF dropped for 10 trading days, which satisfied the time requirement for a secondary reaction. The pullback also exceeded the Volatility-Adjusted Minimum Movement (VAMM, more about it here), so the extent requirement for a secondary reaction was also met.
Following the closing lows on 7/1/24, a strong rally ensued, setting up TLT and IEF for a potential primary bear market signal.
The Table below shows all the information you need:
So, now we have the following options:
1) A primary bear market would be signaled if TLT and IEF jointly break below their 7/1/24 closing lows.
2) If TLT and IEF jointly break above their 6/14/24 bull market highs, the primary bull market would be confirmed, the secondary reaction extinguished, and the setup for a bear market signal canceled. IEF, has already surpassed its 6/14/24 highs unconfirmed by TLT. The longer it takes for TLT to confirm, the more suspect the breakup.
The charts below give you a glimpse of the current situation. The red horizontal lines highlight the 7/1/24 lows whose confirmed violation would signal a new primary bear market. The blue horizontal lines highlight the 6/14/24 bull market highs. The brown rectangles show the secondary reaction, and the blue ones show the recent rally that completed the setup for a potential primary bear market.
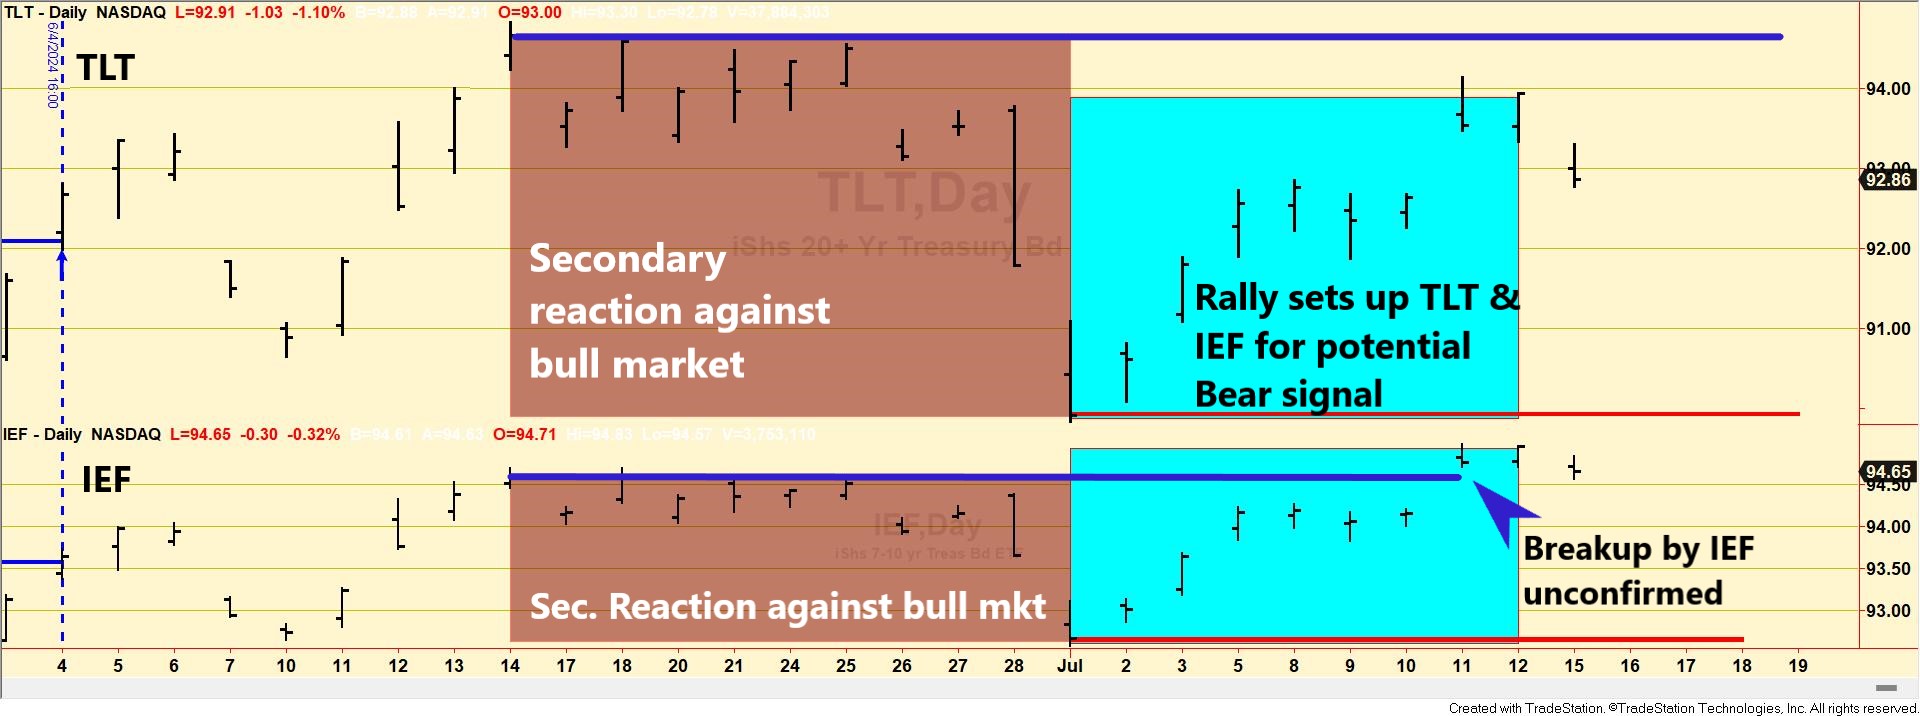
So, now the primary trend is bullish, and the secondary one is bearish.
B) Market situation if one sticks to the traditional interpretation demanding more than three weeks and 1/3 confirmed retracement to declare a secondary reaction.
As detailed in this post, the primary trend was signaled as bearish on 2/13/24.
In this post, I explained that a secondary (bullish) reaction against the bear market was in place.
After the secondary reaction bounce, a pullback followed, setting up TLT and IEF for a potential primary bull market signal.
The Table below shows all the information you need:
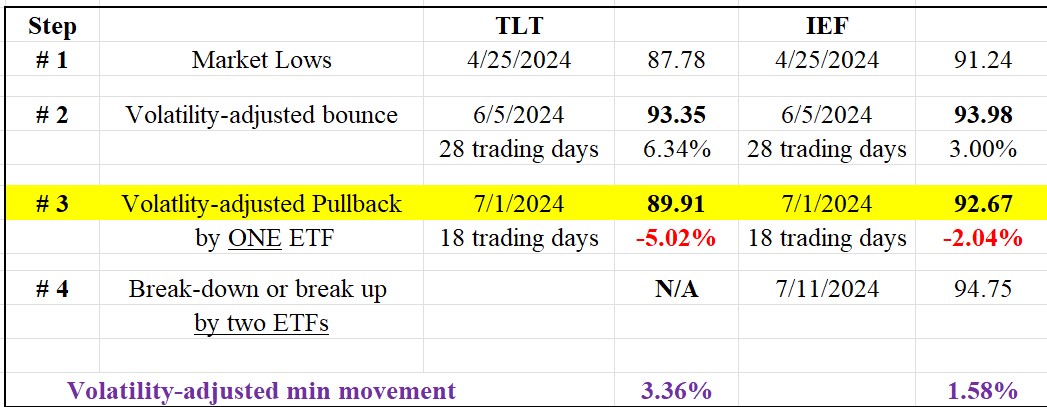
The charts below give you a glimpse of the current situation. The red horizontal lines highlight the 4/25/24 lows, whose confirmed violation would confirm the primary bear market. The blue horizontal lines highlight the 6/14/24 bull highs, whose breakup would signal a new bull market. The blue rectangles show the secondary reaction, and the brown ones show the recent pullback that completed the setup for a potential primary bull market. The grey rectangles highlight a pullback that did not meet the extent requirement to complete the setup for a bull signal.
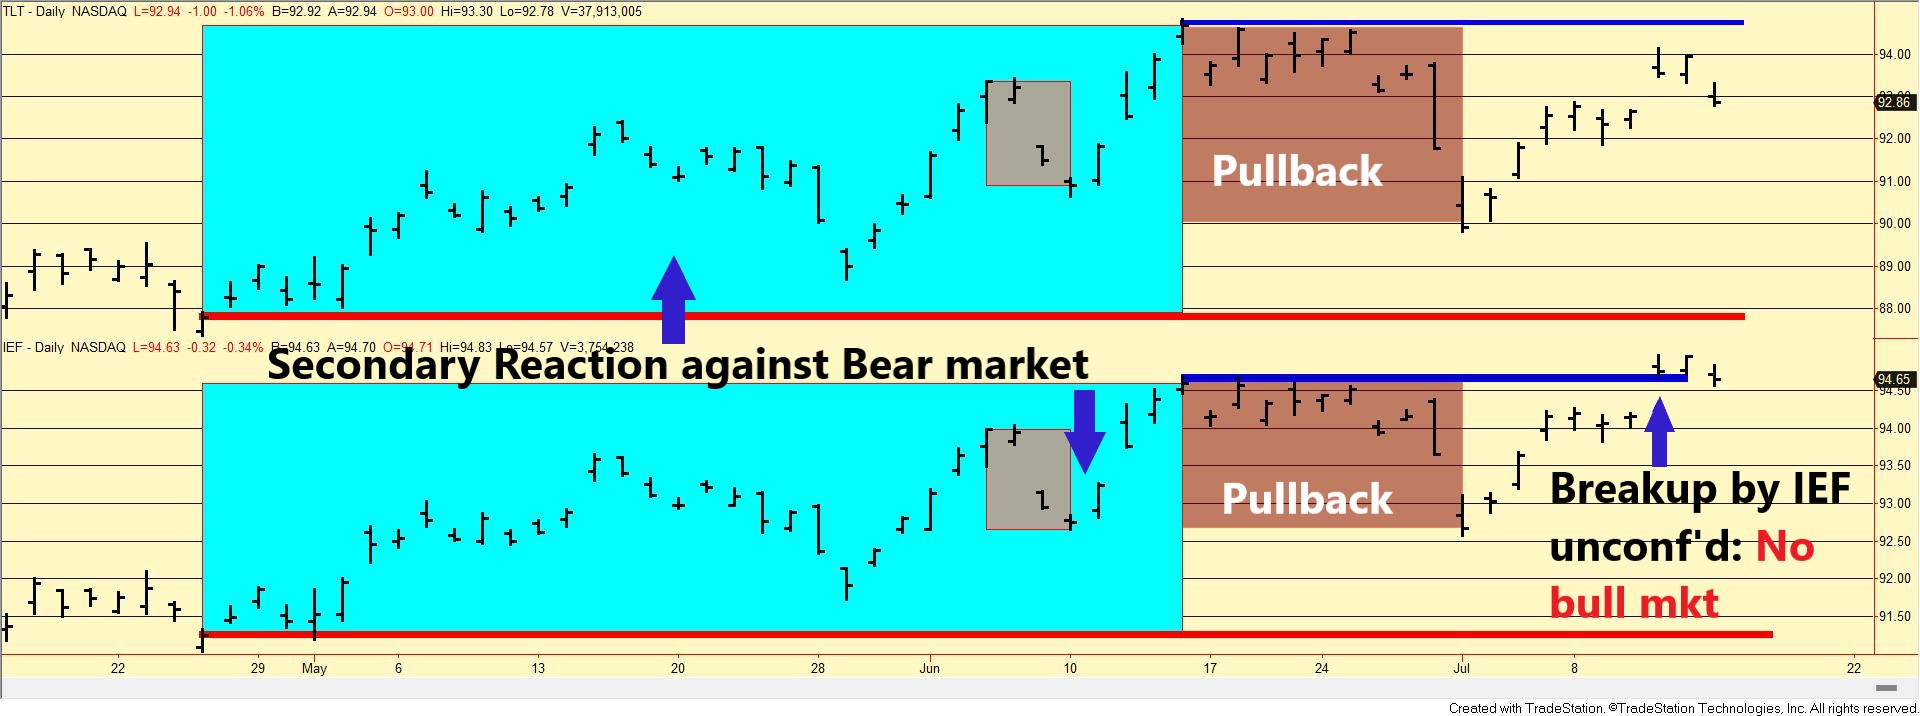
Therefore, the primary trend is bearish, and the secondary one is bullish.
Sincerely,
Manuel Blay
Editor of thedowtheory.com


