
Exploring the Bullish Implications of TLT’s Recent Breakout
Overview: On 7/15/24, I wrote that there was indecision concerning the trend for US bonds. Depending on the time frame one got contradictory readings. You can get the details here.
The indecision is over. On 7/31/24, TLT (long-term maturity bonds ETF) surged higher, which has bullish implications in all time frames, as I will explain below.
Lower interest rates reflect lower inflation or a downturn in the economy. I think both. As my August 1st Letter to Subscribers explained, I have solid economic reasons not to buy easily into the soft-landing narrative. Inflation will only go lower if the economy cools down.
So, let’s get started with the Dow Theory analysis.
General Remarks:
In this post, I extensively elaborate on the rationale behind employing two alternative definitions to evaluate secondary reactions.
TLT refers to the iShares 20+ Year Treasury Bond ETF. You can find more information about it here
IEF refers to the iShares 7-10 Year Treasury Bond ETF. You can find more information about it here.
TLT tracks longer-term US bonds, while IEF tracks intermediate-term US bonds. A bull market in bonds signifies lower interest rates, whereas a bear market in bonds indicates higher interest rates.
A) Market situation if one appraises secondary reactions not bound by the three weeks and 1/3 retracement dogma
As I explained in this post, the primary trend shifted to bullish on 6/4/24.
On 7/1/24, a secondary (bearish reaction) against the primary bull market was signaled (you can find all the details of the secondary reaction here)
On 7/12/24, IEF surpassed its 6/14/24 primary bull market closing highs unconfirmed by TLT.
On 7/31/24, TLT broke up its 6/14/24 primary bull market closing highs and provided confirmation.
The table below gives you the relevant dates and prices:
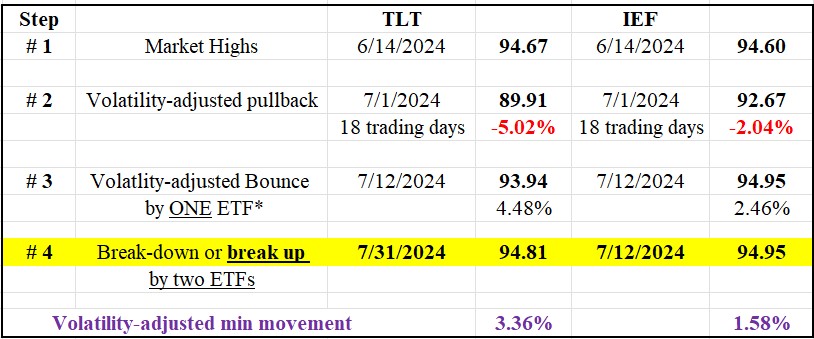
The betterment of the last recorded primary bull market highs implies:
- The secondary (bearish) reaction against the primary bull market has been terminated.
- The setup for a potential primary bear market signal has been canceled.
- The primary bull market has been reaffirmed.
- A primary bear market would be signaled if TLT and IEF jointly violated their 7/1/24 closing lows. Presently, this is a very unlikely event.
The charts below give you a glimpse of the current situation. The red horizontal lines highlight the 7/1/24 lows, and the blue horizontal lines highlight the 6/14/24 bull market highs. The brown rectangles show the secondary reaction, which has been canceled.
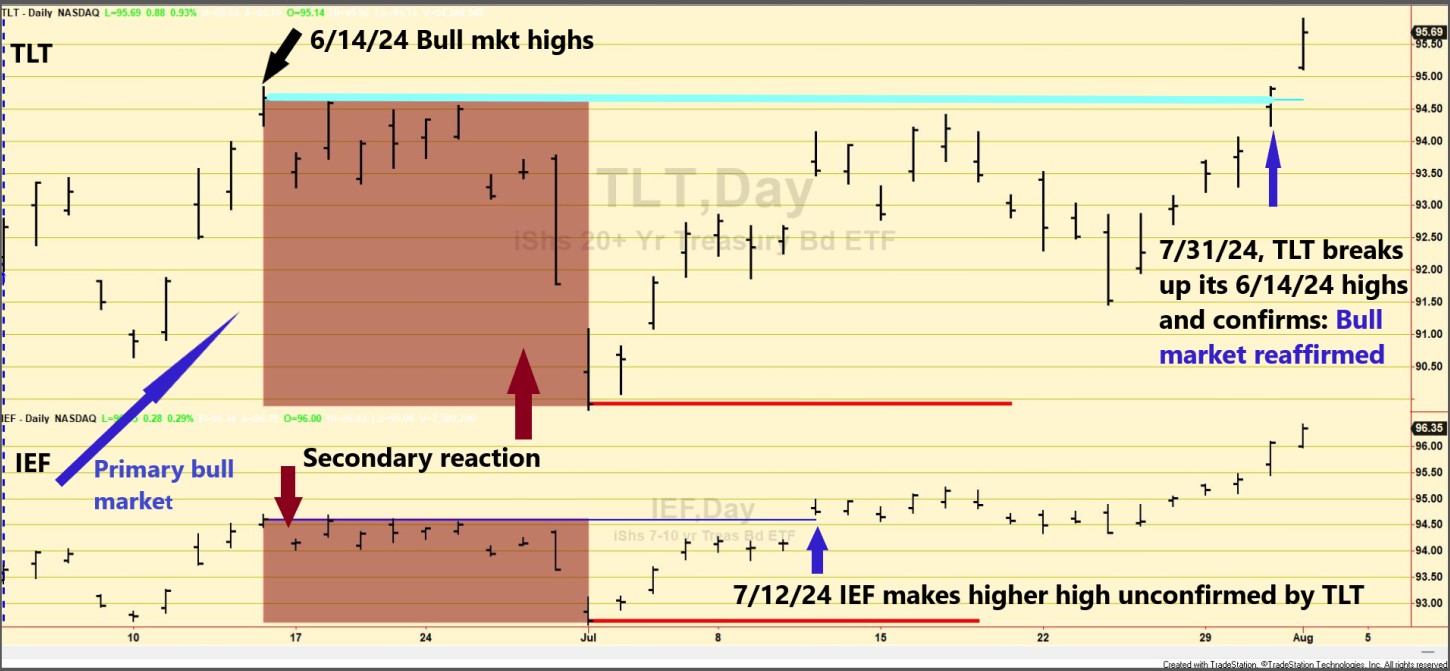
Therefore, the primary and secondary trends are now bullish.
B) Market situation if one sticks to the traditional interpretation demanding more than three weeks and 1/3 confirmed retracement to declare a secondary reaction.
As detailed in this post, the primary trend was signaled as bearish on 2/13/24.
In this post, I explained that a secondary (bullish) reaction against the bear market was in place.
A pullback followed after the secondary reaction bounce, setting up TLT and IEF for a potential primary bull market signal. You can get more details in this post.
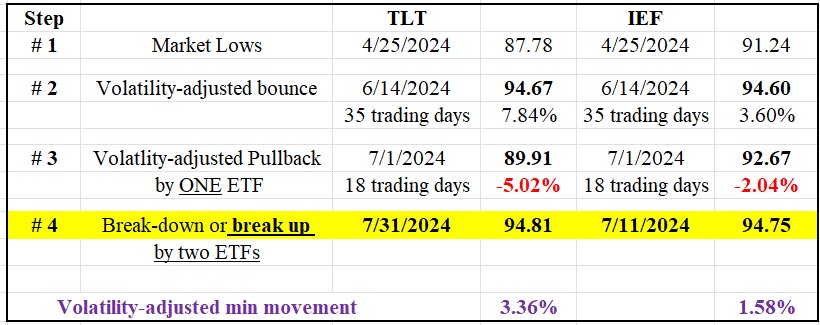
On 7/11/24, TLT surpassed its 6/14/24 secondary reaction highs, unconfirmed by TLT. Absent confirmation, no new bull market was signaled.
On 7/31/24, TLT finally broke above its 6/14/24 secondary reaction highs, provided confirmation, and, thus, signaled a new primary bull market.
The table below gives you the relevant dates and prices:
The charts below give you a representation of the most recent price action. On the left, we see the bear market in action with lower prices until a secondary reaction (blue rectangles) interrupted the decline. Following the 6/14/24 secondary reaction highs, there was a pullback until 7/1/24 (brown rectangles) that set up TLT and IEF for a potential primary bull market signal. The blue lines highlight the secondary reaction highs, which were the critical level to be jointly surpassed for a new bull market. The red horizontal lines show the 4/25/24 bear market lows, whose confirmed violation would signal a new bear market.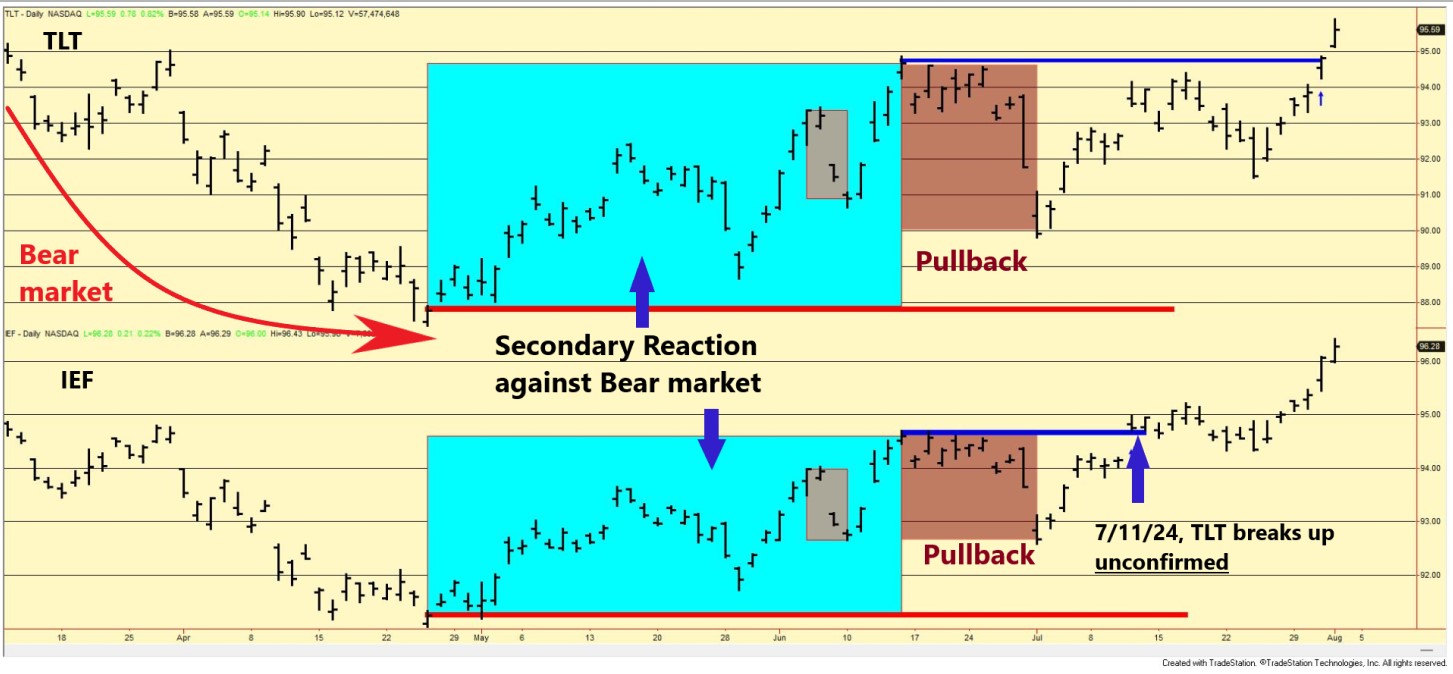 Therefore, we have the following technical situation:
- The primary trend shifted to bullish.
- The secondary trend is now also bullish.
Sincerely,
Manuel Blay
Editor of thedowtheory.com


