(AKA “Everything You Wanted to Know About Recessions, But Were Afraid to Ask)
How to know when one’s coming: As you know from the “Three Tops and a Tumble” Special Reports there are leading advance warning about upcoming Bear markets and Recessions. The first of the three “There’s Something About…Volume” points out that New York Stock Exchange (NYSE) monthly volume tends to peak some 5 or 6 months before the Stock Market itself does. The Bear markets that follow, in turn, tend to ‘predict’ and be followed by Recessions some three-quarters of the time since the turn of the last century. The next ‘top’ to be followed by Bear markets and Recessions is Consumer Confidence. Since 1967 each high point has been followed by a Bear market 6 months later, on average, and a Recession 8 months after that. The final ‘top’ is when the Yield Curve reaches a ratio of .95% of the three-month Treasury bill rate monthly average divided by the ten-year Treasury bond yield, in which case a Bear market follows in 6 to 7 months and a Recession 6 months after that. Those three tops pointed out early in the year 2000 that the Bear market and Recession were coming and pointed to the start of the Recession between January and August of 2001. In November the National Bureau of Economic Research (NBER) announced it ‘officially’ started in March 2001.
Why care if one is coming: If you’re a business person, you’ll want to know so as to adjust your business plan regarding inventory, hiring and cost control in light of probable lower sales and profits. The larger the business, the larger the impact. It is said that Lee Iacocca, when he headed Chrysler, told his chief economist “to just let him know six months before the next recession”. Obviously that is easier said than done. I am told that the “forecasters’ handbook” lists rule number one as “Never, EVER, forecast a recession. This is due partly because it is difficult to do, and then of course nobody likes the messenger who brings bad news. As an investor you will want to know because in almost all cases a Bear market will precede a recession. Of the 21 recessions in the 20th century only 4 were not preceded or accompanied by a bear market.
How to know if one is occurring: Subscribe to our Newsletter. Our subscribers knew in December of 2000 from the Special Report that Rising Unemployment would confirm when the Recession had begun far sooner than the NBER would. Indeed, unemployment rose +4/10th of a percentage point on a 3 month moving average by April 2001, an event that has lagged the start of recessions by 1.4 months since 1946, pointing to March as having been the start as was later confirmed by the NBER. Our March 1st, 2001 Letter stated that “a mild recession looks like a ‘done deal’”. At that time 95% of American economists said there would not be a recession, but, of course, there was one which the NBER later determined had started that month.. A +4/10ths rise also occurred in January of 2008 which prompted me to write “A recession is no longer approaching….it is here now.” Later the NBER proclaimed the recession had, indeed, started in December 2007.
Bull markets begin during recessions. The good news about Recessions is that Bull markets begin in their midst. 24 of the 25 Bull markets over the last 100+ years started during recessions. The continued rise in unemployment in 2001 pointed to the Bear market’s end and the Bull market’s start when it rose a full 1% in August as reported on September 7th, just 2 weeks before THE lows on 9/21/01. The average rise of unemployment during the last 8 bear markets that were accompanied by recessions was +1.7% by the time the bear market ended. In 2008 that was the level of unemployment rate increase at which the bear market bottomed. An even more timely indicator of the lows, however, was the Capitulation Special Report (augmented by an e-mail the evening of 9/20) which showed total capitulation and therefore a buying opportunity on THE day of the Bear market lows, from which the Bull market began.
How to know when Recessions will end: Bull markets are, of course, leading indicators of economic expansion as shown in “The Stock Market as a Business Cycle ‘Predictor’“. In the 20th century every Bull market was accompanied or followed shortly by economic expansions. Recessions ended some 4 months on average after Bull markets started. In 2002 that pointed to January-February. The average length of Recessions since the depression had been 10 ¼ months, also pointing to January-February of 2002. Nine of the last eleven Recessions ended in less than a year, again pointing to January-February of 2002. But those were historical averages, is there a better way of knowing without waiting for the NBER to announce perhaps as late as 21 months later as they did the last recession? Fortunately there is something about…..Capacity Utilization that tells us when the recession is over. In late 2001 it signaled that the recession probably ended in December rather than January- February of 2002. Later it was determined to actually have ended in November of 2001. In 2009 it signaled June as being the end. In 2020, it was a coincident indicator signaling the end of recession in June.
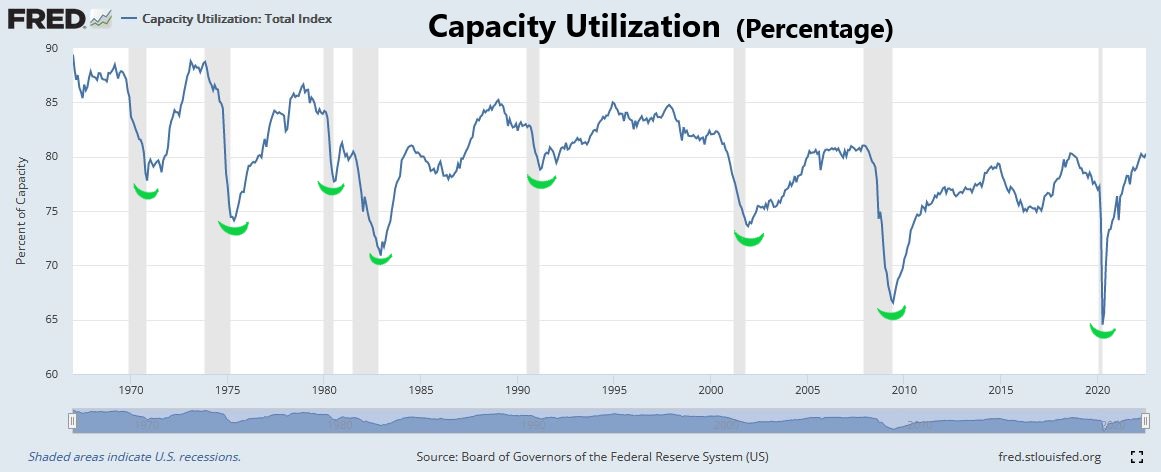
Shaded areas are recessions as defined by the Nat’l Bureau of Economic Research (NBER)
Source: http://www.federalreserve.gov/releases/g17/current/ipg1.gif
| Capacity Trough: | Lowest level: | Rec'n Start: | Rec'n | Capacity Trough to | Bull Market Start: | Capacity Trough to |
|---|---|---|---|---|---|---|
| End: | Recessions End: | Bull Start: | ||||
| Nov-70 | 77.70% | Dec-69 | Nov-70 | Same month | May-70 | 5 month lag |
| Mar-75 | 72.6 | Nov-73 | Mar-75 | Same month | Dec-74 | 3 month lag |
| Jul-80 | 78.5 | Jan-80 | Jul-80 | Same month | Apr-80 | 3 month lag |
| Dec-82 | 71.1 | Jul-81 | Nov-82 | One month late | Aug-82 | 4 month lag |
| Mar-91 | 78.1 | Jul-90 | Mar-91 | Same month | Oct-90 | 5 month lag |
| Dec-01* | 74.4 | Mar-01 | 11/01** | One month late | 1-Sep | 3 month lag |
| Jun-09 | 68.2 | Dec-07 | 7/09 | One month late | 9-Mar | 3 month lag |
| April-20 | 64.53 | Feb-20 | April-20 | Same month | 4/6/20 | 0 month lag |
*1/02 level was reported as 74.2 on 2/15 but revised on 3/15 to 74.5 along w/ Feb at 74.8
**Recessions starts and ends are not determined by the NBER until many months later, July of 2003 in this case..
Since 1967 when the Federal Reserve began reporting this Index there have been eight Recessions shown above in gray. In each of the previous recessions there has been a trough in the capacity utilization index that bottomed coincident with the recessions ending. In 1970, ’75, ’80 and ’91 the low month for capacity utilization was the month that the recession ended. Twice it was one month later. Note there was a trough in 1986 but no Recession to announce the end to.
This indicator signals the end of an economic recession as identified by the Schannep Recession Indicator but probably not yet announced by the National Bureau of Economic Research (NBER). During such recession a new Bull market as identified by Schannep’s Bull definition has always begun. From that point forward the first uptick in Capacity Utilization identifies the recession’s end. Since this index is reported mid-month for the prior month one can see the next month if the level was lower than the previously reported month, or higher. The first increase after the new Bull market will identify the prior month as having ended the Recession!
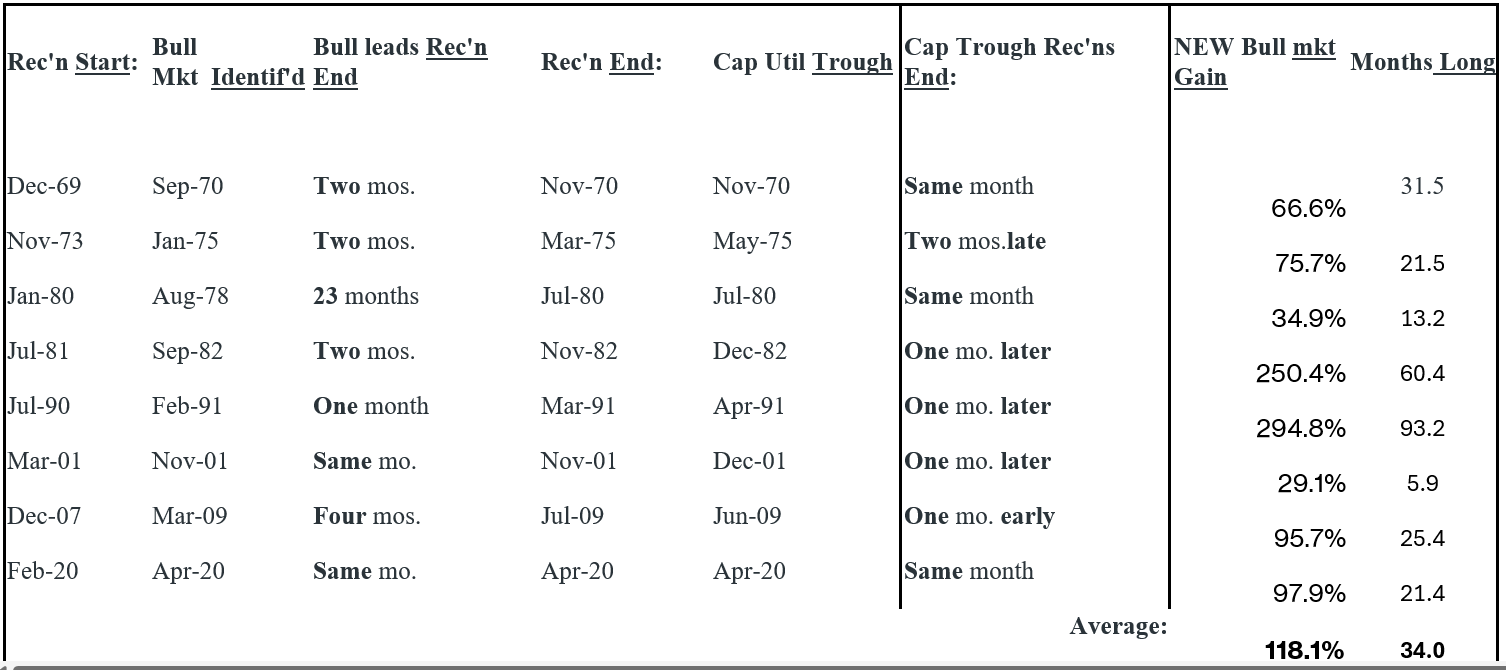
The chart above shows that the trough typically lags the start of new bull markets by 3 to 5 months. The thing about recessions is that they always end, and for the last 40 years Capacity Utilization has told when they ended. The advantage of knowing when a recession ends is that it assures the bull market’s continuance. Bull markets have always continued after recessions end – from a minimum or 4 to 5 months to as long as 78 and 88 months! The last Bull market that started on 3/23/2020 has not been an exception to the rule and rose 97.93% for almost two years.
The last 12 recessions were identified in the early stages by the Schannep Recession Indicator. Every time the 3-month average of the Unemployment Rate rose the 0.4% threshold from the previous 3-month cyclical low was met, the stock market declined with a significant further average drop of -16.85%. After any such decline, and still during recessions, Bull markets have always started and become identified by Schannep’s Bull definition. After that, the first uptick in Capacity Utilization identifies the end of each recession and the average gain of the Bull markets born amids the recession average 118.1%.
The data was first available in 1967 when the Federal Reserve started reporting Capacity Utilization and the following shows the dates of the Capacity Utility troughs as the dates of the Schannep Recession Ending Indicator:


