A One-Two Punch — In Our Favor!
“The trick is not to learn to trust your feelings but to discipline yourself to ignore them”-Peter Lynch
Overview: April got off to a rough start. The market dropped sharply in the first few days, triggering our Capitulation Indicator on April 7th and again on the 8th, suggesting a bottom. After that, we got a strong rally. Capitulation calls for a 50% allocation in the Composite, DT21C, and BTI. Accordingly, all three indicators are now set to YELLOW (50% invested), as shown in the stoplight chart above.
Our December 31st, 2024 Letter proved to be prophetic. In it, I warned that the 3-month/10-year yield curve had un-inverted, noting that “Un-inversions have a negative effect on the stock market.”
The Letter also highlighted that “with one exception (11/3/78), all un-inversions during bull markets ultimately led to bear markets.”
Fast-forward to today: the S&P 500 peaked on February 19th, 2025, and declined 18.90% through its April 8th, 2025 bottom (20% intraday), on which date our Bear market definition was met.
In that December Letter, I mentioned that, based on historical averages, the market could remain strong for several more months before a potential downturn. However, I explained that the un-inversion signaled trouble ahead and that a Bear market was a distinct possibility. The tariff war hastened what was already in motion, and the anticipated Bear arrived sooner than I had projected.
Below is the same table from the December 31st Letter, now updated to reflect the current bull market top (2/19/25), the Bear market, and—at least for now—what appears to be the final low.

Historically, yield curve un-inversions have led to recessions every time—except once: the 1966 inversion, which resulted in a Bear market but no recession. If a recession were to occur in the coming months, the stock market could fall further. Why? When Bear markets are associated with recessions, the drop averages 35% vs. an average decline of only 24% when no recession materializes.
The big silver lining is that we had Capitulation on April 7th, which persisted on April 8th. Capitulation is a powerful Bear market killer.
The median decline from the first day of Capitulation to the ultimate market bottom is 1.7%. Of the 17 Capitulation events analyzed (excluding the most recent), only three—1974, 2008, and 2020—fell more than 10% short of the final low. The remaining 14 were strikingly close to the bottom.
In the Mid-Month Update (see Appendix), I noted that Capitulation often offsets the bearish implications of our Bear Market Definition (BMD). I cited four past overlaps between Capitulation and the BMD. Trader and YouTuber Alessio Rastani pointed out a similar case in 2018, which I had missed because the BMD occurred on December 21st, and Capitulation followed on December 24th—just three days apart, a gap I had mistakenly considered too wide.
However, December 21st was a Friday, and the 22nd and 23rd fell on a weekend, meaning the two signals occurred on consecutive trading days. So, the Bear Market signal in 2018 was indeed closely aligned with the Capitulation event.
Since 1962, there have only been five overlaps: 1990, 1998, 2011, 2018, and 2020.
In four out of five cases (1990, 1998, 2011,2018), Capitulation halted the Bear market, resulting in only modest further declines. The exception was March 2020, when the market fell another 18.54% after the Bear market definition, and there was a recession.
The table below gives you the fully updated data, including the 2018 event:
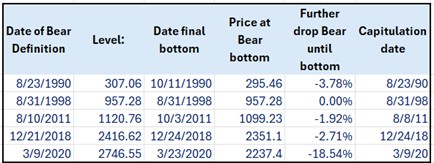 Bear definitions also entail a higher risk of being followed by recessions. As detailed in this Report, 64% of Bear markets have historically been followed by a recession. However, among the five Bear markets that coincided with Capitulation, only one—2020—also saw a recession, and the 2020 bear was a real oddity as an external shock caused it. It seems that Capitulation “repels” recessions most of the time.
While the sample size is small, this pattern suggests that Capitulation often signals that the market has already priced in potential negatives.
But the good news doesn’t stop here. This Capitulation has been followed by a Zweig Breadth Thrust (ZBT) that triggered on 4/24/25. The ZBT is associated with significantly higher stock market prices over the next 12 months. I researched what happens when Capitulations are followed within the next 3 months by a ZBT. The results are too good to be true, as the table below shows. The average return of the S&P500 six and twelve months after Capitulation when a ZBT overlapped is a whopping 22.85% and 32.15%, respectively.

When Capitulation is not followed by a ZBT, the performance, while still strong,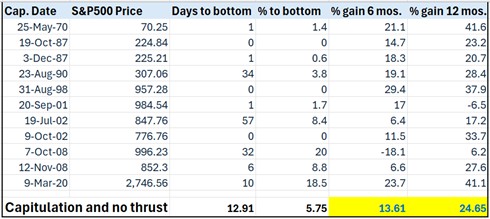 is less exceptional, with average gains of only 13.61% and 24.65% over the subsequent 6- and 12-month periods, respectively, as the left table shows.
Key Takeaway: This Capitulation signal has strong potential to drive significantly higher prices in the coming months. However, if the yield curve’s recent un-inversion—consistent with its historical tendency—leads to a recession, the bullish impact of Capitulation could be weakened, especially over the next six months. In that case, the bear market may resume its downward trajectory, much like it did in 2020—the only time in recent history when capitulation coincided with a recession. That said, unlike in 2020, we now have a breadth thrust in play, which gives me greater confidence this time.
From a multi-market perspective, the worst appears to be over, as highlighted in this recent post, which also analyzes performance following previous Zweig Breadth Thrusts.
The December 31st, 2024, Letter was titled “A Bipolar Market “ because margin (MD) debt was flashing two opposite outcomes: either a powerful continuation to the upside or a sharp downturn. No middle ground. Subsequent price action proved MD’s message right: a severe drop.
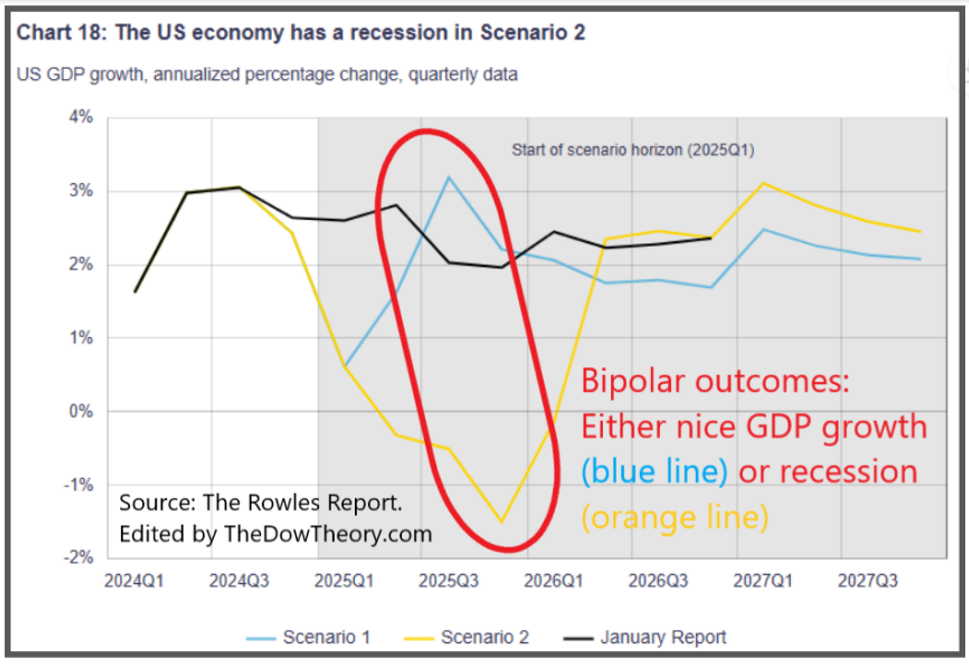 The left chart, courtesy of Shaun Rowles (The Rowles Report, UBS, 4/17/25), illustrates the forward-looking implications for GDP of this “bipolar” setup.
- Scenario 1 envisions the introduction of tariffs, followed by a de-escalation through negotiations, allowing the U.S. to avoid a recession.
- Scenario 2 outlines a prolonged tariff standoff that escalated into a full-blown global trade war. Under this scenario, the U.S. would fall into recession by mid-2025.
GDP for Q1 2025 came in at -0.3%. Is this bearish for stocks? I don’t think so—for three key reasons:
- The market already discounted it. Stocks fell nearly 20% during the tariff scare, well before this GDP print. As always, price leads the news, not the other way around.
- The details matter. The contraction was driven mainly by a surge in imports ahead of expected tariffs—gold imports were especially strong. In addition, the DOGE initiative reduced government outlays, which also dragged on GDP. However, the U.S. consumer market held up well, with annualized consumption rising to 1.8%.
- GDP doesn’t predict market direction, nor recessions. As noted in the August 1, 2024, Letter, GDP data is a poor guide for future stock performance.
So, if the market ultimately tanked, the culprit isn’t GDP—we’ll have to look elsewhere.
| Curious about Capitulation? Check out this evergreen 2021 video by Alessio Rastani, where I was thrilled to be a guest! It’s loaded with dynamic insights that vividly explain how Capitulation works. Check it out! |
Let’s go to the technical section of our Letter.
Clarification: All references below to days and prices refer to trading days and closing prices.
The DOW THEORY for the 21st Century (DT21C): The average annual gain for this Indicator since year-end 1953 would have been 13.65% vs. 11.08% for Buy and Hold on 12/31/24.
This Indicator is YELLOW (BUY 50%) as of 4/7/25 at 37,965.60 due to the 4/7/25 Capitulation, bringing it to 50% invested. Previously, and due to the 3/4/25 SELL, this indicator was RED (0% invested).
On 4/30/25, a secondary reaction (bounce, Step #2 in the table below) was signaled when the Dow Industrials finally surpassed its 4/9/25 highs and confirmed the S&P500. Hence, the time requirement (5 trading days following Capitulation, Rule # 1 of the Special Report) and the extent requirement (at least >=3% on the S&P500 and one other Index, Rule # 2 of the Special Report) have been fulfilled.
We only need confirmation from either the Dow Industrials or the Dow Transports—one is enough to validate the existence of a secondary reaction (bounce, Step #2).
Now, we are looking forward to a pullback of at least 3% on the S&P 500 and one of either the Dow Jones Industrials or the Dow Transports, lasting a minimum of two trading days.
Such a pullback would have two effects:
- The DT21C and the Composite would shift to 75% invested (from the current 50%), increasing our current exposure by 25%.
- The setup for a potential DT21C BUY would be completed.
The Table below shows the most recent price action:

So, what’s next?
Our re-buy signal will be triggered once our Bull Market definition is fulfilled—specifically, a 19% rise in both the Dow Industrials and the S&P 500. For the BUY signal to activate, the following price levels must be reached jointly:
 This is our “re-Buy” of last resort and currently the one in force. The good news is that if the pullback described above materializes, our next BUY will occur at significantly lower price levels, and you will be punctually informed.
We will check the markets and keep you apprised by email (and Discord for those who signed up) of any changes.
The Original Dow Theory: Charles Dow’s Theory is RED (“SELL”) as of 3/10/25 at 41,911.71. The Dow Industrials and Transportation made their respective highs on 12/4/24 and 11/25/24 (Step #1 in the table below), respectively. Following such highs, a pullback ensued, reaching >=15 confirmed days (Step #2) and hence qualifies as a secondary reaction.
From such lows (Step #2), a rally ensued until 1/15/25 (Step #3). Such a rally lasted >=2 trading days and is >= 3% in the two Indexes, so the setup for a potential SELL was completed.
The Dow Transportation pierced its pullback lows (Step #2) on 2/27/25, and the Dow Industrials 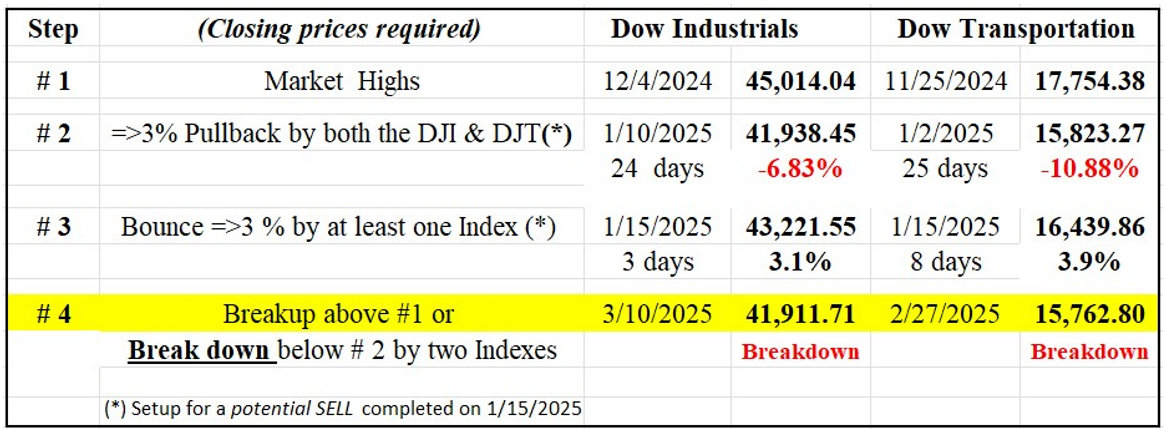 confirmed on 3/10/25, triggering the new SELL. The left Table shows the price action that led to the Sell signal.
The most recent rally did not reach 15 confirmed days, so there is no secondary reaction under the original Dow Theory.
We remind you that the “original” Dow Theory is not our main thrust in these Letters, as the DT21C is an even superior timing system. We just monitor the original Dow Theory as we feel very few apply it correctly, and the above is how it should be interpreted.
Blay TIMING INDICATOR (BTI): This proprietary market timing Indicator would have had an average annual increase of 14.73% since 12/29/78 vs. 12.21% for Buy and Hold on 12/31/24.
The BTI is in YELLOW (50% invested, for those who invest in it) due to a simultaneous Sell signal and Capitulation on 4/7/25. Our 4/7/25 email (reproduced in the Appendix below) provides more details.
Margin debt (MD) for March, released on 4/15/25, dropped by 4.1%, shifting the MD trend to bearish.
Another BTI component, market health (MH)—which reflects the ratio between “aggressive” and “defensive” indexes—moved from 0 to 1 (on a scale from 0 to 3), representing improving market health.
At this stage, our re-buy signal will be triggered once our Bull Market definition is fulfilled—specifically, a 19% rise in both the Dow Industrials and the S&P 500. For the BUY signal to activate, the following price levels must be reached jointly:
 This is our “re-Buy” of last resort and currently the one in force. The good news is that our next BUY will likely come at a lower price level, provided MH and/or MD improve.
I continue to monitor the BTI daily and will inform you immediately if a BUY signal is triggered.
More about the BTI HERE. You may read the Q&A on the BTI HERE.
We will, of course, advise you by email should a change occur.
The COMPOSITE Timing Indicator: This is our primary major-trend timing indicator, which we use in our real-money portfolio. The Composite draws signals from the DT21C and the BTI. 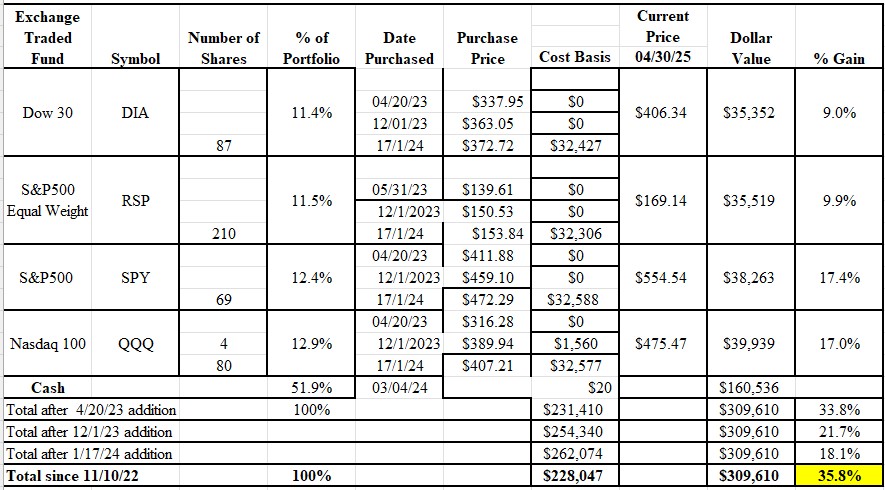 On 12/31/24, it would have shown an average annual increase of 13.41% since 1953 vs. 11.08% for Buy and Hold.
The left table shows the current status of my actual portfolio.
The Composite is in YELLOW (50% invested, for those who invest in it) due to a simultaneous Sell signal on the BTI and Capitulation on 4/7/25. You may find more details in our 4/7/25 email in the Appendix below.
If the DT21C experiences the 3% pullback outlined in the DT21C section above, we would increase our position by 25%, bringing the Composite to 75% invested.
I uploaded the total return record for the Composite based on the DT21C and the BTI. It scored a 14.84% compound annual increase from 12/29/78 to 12/31/24 vs. a 12.21% gain for Buy & Hold (DJIA Total return) over the same period, with significantly lower drawdowns. You may find it at the bottom of the Special Report (scroll down).
DT21C + Relative Strength Strategy. This strategy targets a significant outperformance vs. Buy & Hold over the long run by having an effective trend filter (the DT21C) along with high relative strength ETFs. The DT21C+RS strategy moved to 50% invested following the Capitulation signal at the open on 4/8/25.
If the DT21C experiences the 3% pullback outlined in the DT21C section above, we would increase our position by 25%, bringing the DT21C+HRS to 75% invested, and you will be alerted.
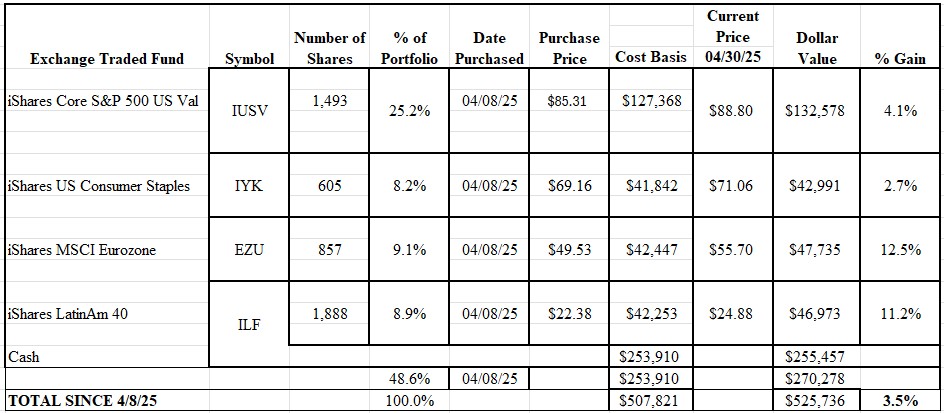
The table below shows the status of my actual portfolio on 4/30/25.
The BOTTOM LINE: The market is inherently forward-looking. When a breadth thrust follows Capitulation, it often signals that the worst has already been priced in—or that the anticipated “worst” may not turn out to be so dire after all. If uncertainty begins to ease and the U.S. refrains from dismantling free trade, the potential for a strong rebound is substantial.
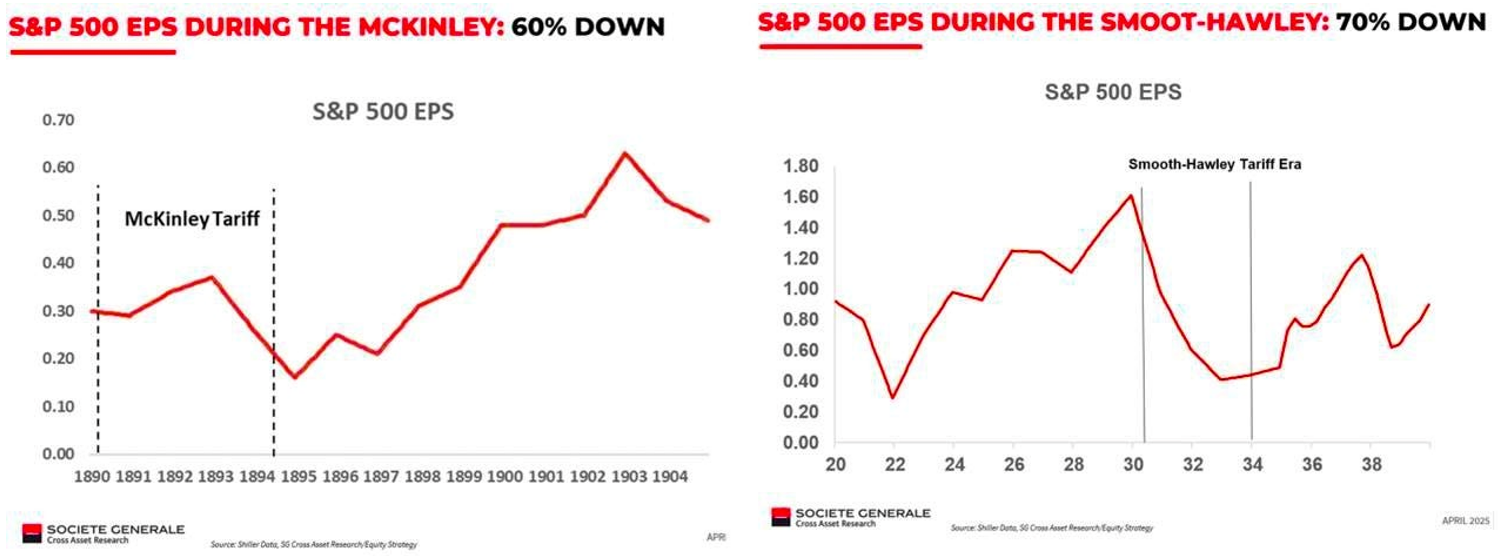
That said, while the 21st century is markedly different from the 19th and 20th, with the U.S. economy now heavily weighted toward services rather than goods, history still offers a chilling warning. As illustrated in the charts below, periods of historically high tariffs have been toxic for corporate earnings. In the two most notable cases, earnings per share (EPS) fell by 60% to 70%. For context, the median EPS decline during recessions since 1949 has been a relatively modest 13%, with the stock market typically dropping around 35%.
If a trade war were to slash EPS by even “just” 25%, the resulting market fallout could be devastating—so much so that revisiting, or even breaking below, the April 8th lows would not come as a surprise.
That said, we trade what the market gives us—and if you’ve been tracking my two portfolios, you’ll see we’ve navigated the storm quite well.
See you soon in our Mid-month update, or even earlier should market developments dictate.
.………………………………………………………………………………………………………
For longer-term results, see The Composite Timing Indicator, which we use for timing in our Portfolio versus Buy and Hold. Over 71 years, the Composite has grown at a 13.41% annual rate compared to Buy & Hold’s 11.08%, crucially with significantly reduced drawdowns and superior risk-adjusted performance. This combination of higher returns and lower risk makes it exceptionally attractive for investors. This real-money Portfolio represents only what Manuel is doing, which could be very different from others. Subscribers use this letter for Market Timing, which could include shorting, going long, and even utilizing leveraged investments that could double or triple – in either direction. Our results have been monitored by several independent sources that track our performance, such as Hulbert Financial Digest, DowTheoryInvestments.com, CXO Advisory Group and TimerTrac.com.
This Letter concentrates on the big picture, the trend of the major stock market indexes, which usually influences the price direction of most individual stocks.
………………………………………………………………………………………………………
Update for Crypto, U.S. bonds, precious metals, and their ETF miners
CRYPTO: Bitcoin’s primary trend is bearish, and its secondary trend is bullish. The May 1st Crypto Report is linked HERE.
U.S. BONDS (TLT & IEF): As I explained in this post, the trend was signaled as bullish (yes, not a typo) on 4/4/25, which means lower interest rates. The most recent “scare” pullback did not qualify as a secondary reaction. So, the primary and secondary trends are bullish.
Gold (GLD) and Silver (SLV): As I explained in this post, the primary trend was signaled bullish on 4/2/24. The setup for a potential primary bear market was completed on 11/20/24. On 11/27/24, SLV breached its 11/15/24 secondary reaction low, but GLD didn’t confirm, preventing a bear market signal. GLD (and gold) reached a new all-time high on 1/30/25, so once again, the principle of confirmation has saved our skin by not triggering a SELL on SLV’s breakdown. I know I insist ad nauseam on the principle of confirmation (examples HERE and HERE), but it really works wonders in avoiding whipsaws and is a key tenet of the Dow Theory.
However, in the unlikely case that GLD pierced its 11/15/24 secondary reaction low at 236.59 on a closing basis, a primary bear market would be signaled. The primary trend is bullish, and the secondary trend is bearish.
Gold and Silver miners’ ETFs (GDX & SIL): As I explained in this post, the primary trend was signaled as bullish on 3/13/25. The secondary trend is bullish too.
These monthly updates on Crypto, US Bonds, Gold, Silver, and mining ETFs are meant to provide a helpful overview of their status from a Dow Theory point of view. When events unfold after the monthly Letter is published, it is incumbent on the reader to follow his/her own positions. In the future, we plan to follow these markets on a timelier basis, just as we currently do with the American stock market.
Manuel Blay
Editor
for TheDowTheory.com Team
Jack Schannep
Editor Emeritus
Please help keep an edge and reward our efforts by not forwarding or otherwise distributing this Letter. Its contents are for the exclusive use of each Subscriber. If you are reading this Letter without being a Subscriber, please sign up HERE. If you are an institution and want to make our Letter available to your clients, students, or personnel, you may contact us (subscribers@thedowtheory.com) for a special plan.
If you find it useful, please give a referral. Thank you!
The Dow Theory and other indicators are forms of technical analysis for detecting market trends to determine investment strategies. Interpretations may vary among analysts, and opinions expressed on this website may not be shared by others applying the same principles. This material is for general information only and is not intended to provide specific advice or recommendations for any individual. Our Letters and communications are provided to our Subscribers “as is.” This implies no obligation on the part of the Editor or our staff to address inquiries regarding the content, interpretation, or clarification of our Letters and communications that are unrelated to subscriber-specific issues (such as credit card inquiries, changes of email, changes in subscription plans, etc.). While we may attempt to address general questions regarding the markets, we are not obligated to do so. Under no circumstances will we respond to inquiries that could be construed as specific advice tailored to the needs of an individual. There is no assurance that the views or strategies discussed are suitable for all investors and will be profitable or without the risk of loss or will equal the performance of the benchmark portfolio. Please consult your financial professional before investing to determine which investment(s) may be appropriate for you. All investments involve the risk of potential investment losses as well as the potential for investment gains. The performance of any portfolio or investment strategy should be viewed in the context of the broad market and prevailing economic conditions. References to markets, asset classes, and sectors generally reflect the corresponding market index. Indexes are unmanaged statistical composites and cannot be invested into directly. Index performance is not indicative of any investment’s performance and does not reflect fees, expenses, or sales charges. All performance shown is historical, and there is no guarantee of future results. Past performance is not an indication of future returns. We are unaware of any readers’ personal circumstances, financial condition, risk tolerance, or goals and objectives, so nothing read here should be considered advice suitable for them and is not to be construed, under any circumstances, by implication or otherwise, as an offer to sell or a solicitation to buy or sell or trade in any commodities or securities herein named. We assume no liability for any trade taken in pursuance of our email (Discord) notifications or this monthly Letter, even in the event of a typo or wrong interpretation of the market. Information is obtained from sources believed to be reliable, but is in no way guaranteed. TheDowTheory.com reserves the right to modify, add, reduce its contents, format, or website, as well as alter subscription levels and the contents therein, pricing, etc., at any time. The audio version is a supplementary service subject to cancellation without notice. It is not downloadable, and access is not guaranteed. We provide no customer support for audio-related issues. The written version remains the primary and authoritative format.
APPENDIX: Emails sent to Subscribers in April 2025
Email sent on 4/4/25
Email title: The BTI triggered a conditional Sell signal for 4/7/25 at the close. Please read the entire email below.
Note: All references to days and prices refer to trading days and closing prices.
This is a crucial email issued at a technically complex juncture. I’ve done my best to be
precise—please read the following carefully.
Executive Summary:
- The Blay Timing Indicator (BTI) has issued a conditional SELL signal for Monday,
April 7, 2025, at the close.
• The Composite will shift to 0% invested on 4/7/25 at the close.
• However, if Capitulation is signaled at the close of 4/7/25, we will not sell and
will keep the Composite 50% invested.
• No changes in the DT21C, nor in the DT21C+Rel. Strength.
Blay Timing Indicator (BTI):
Market health (MH), measured by the ratio of “aggressive” to “defensive” indexes, currently
stands at zero on a scale from 0 to 3—where 0 indicates poor market health and 3 reflects
excellent conditions. A steep market drop, coupled with lousy market health at 0, finally
triggered a BTI SELL for April 7, 2025, with recommended execution near or at the close.
If Capitulation occurred at the close on April 7th, 2025, Capitulation would prevail, and
the BTI SELL would be canceled.
See the Capitulation section below for details.
The Composite Indicator:
This is one of my actual money portfolios.
The 4/7/25 BTI SELL will bring the Composite to 0% invested (100% cash or short-term
interest-bearing instruments). Next Monday, 4/7/25, near the close, I will sell all my DIA,
RSP, SPY, and QQQ to reduce my ETF holdings to 0%. So, the Composite will be in RED
(SELL).
Note on execution: Statistically, SELLs derived from the BTI have better odds of getting a
better exit price by selling near the close. By “near,” I mean from around 3:58 p.m. to
seconds before 4 p.m. New York time. However, “statistically” is not a guarantee of always
getting a better price by waiting until the close. Nonetheless, I will trust the statistical odds
and wait for Monday’s close to sell. This is particularly important this time, as Capitulation
could cancel the BTI Sell signal.
If Capitulation occurred at the close on April 7th, 2025, Capitulation would prevail, and
the BTI SELL would be canceled; hence, the Composite would remain at 50% invested.
More details are included in the Capitulation section below.
More about the Composite HERE.
Capitulation:
Capitulation occurs when a severe drop in the stock market has brought it to highly
oversold levels, favoring a strong rebound. Our Capitulation Indicator has the uncanny
ability to trigger near market lows. More about Capitulation here and here.
To trigger Capitulation, two of the following three indexes must close at or below their respective Capitulation levels shown in the table below.
These levels remain valid for the entire week of April 7, 2025.

These price levels are valid for the entire week starting on April 7, 2025.
We only need two of the three above Indexes to close at or below the Capitulation price levels shown above. Any combination of two Indexes is adequate to signal Capitulation.
- If Capitulation occurs after the BTI SELL (i.e., from Tuesday, April 8th), the Composite will revert to 50% invested (yellow).
- If Capitulation and a Bear Market Definition (BMD) trigger simultaneously, Capitulation will take precedence, and the Composite will be 50% invested.
- If Capitulation is signaled at the close on 4/7/25, it will override the BTI SELL, and the Composite will remain at 50%. I will notify you accordingly.
Note: If this seems complex—especially for newcomers—rest assured, we haven’t seen a market this tricky since 2020. I am closely monitoring developments and will keep you informed.
Bear Market Definition:
The price levels that must be jointly met for our Bear Market Definition (BMD) to trigger are:

So, the Dow Industrials is still relatively far from attaining the BMD. Please mind the word “jointly”: both the S&P 500 and the Dow Industrials must be below the prices shown in the table above.
These price levels are final and will not change (unless we get new all-time highs, which are not on the horizon at this moment)
Since both the DT21C and the BTI are already in SELL mode, a BMD will not affect the state of our Timing Indicators. So, nothing to do.
DT21C+Relative Strength Strategy:
The DT21C+RS strategy is in cash or short-term interest-bearing instruments, following the 3/4/25 DT21C sell signal.
More about the DT21C+RS HERE.
Closing remarks on the stock market:
The current price action bears an eerie resemblance to March 2020, when COVID-19 triggered widespread market panic. Are markets overreacting this time—or, in their collective wisdom, are they detecting trouble ahead?
Could tariffs prove even more damaging to the economy than COVID-19? We’ll find out soon enough. If the selloff continues, the market may already be delivering its verdict.
Moments like this test our discipline. In my experience, now is precisely when discipline matters most. It’s not the time to second-guess our Timing Indicators or cling to a position hoping the bottom is near. As legendary trader Paul Tudor Jones once said:
“The worst mistake of a trader: losing money on a trade. The second worst mistake: making money on a trade that should have lost, because you broke your rules. That reinforces bad behavior.”
U.S. BONDS (TLT & IEF): Today (4/4/25), the primary trend shifted to bullish, as TLT surpassed its 3/3/25 closing high at 92.57 and confirmed IEF, which had already broken up on 4/1/25. While I will write a comprehensive post soon, this recent post contains a depiction of the key price levels. The primary and secondary trends are bullish now.
If we couple an inverted yield curve with a new primary bull market in bonds (which implies lower interest rates), the message we receive is one of lower growth, or worse, a recession.
Despite all the markets moving like a roller coaster, the trend has not changed for Bitcoin, gold, silver (what a drop!), and their ETF miners. I liked Bitcoin’s action, which closed up.
Next Monday, April 7, 2025, regardless of the outcome, I will send an email near the close.
Email sent on 4/4/25
Email title: It seems we are getting Capitulation, which would result in no action.
Executive summary:
Note: All references to days and prices refer to trading days and closing prices.
The market remains volatile, so my outlook may shift by the close. Sometimes, we simply must take what the market gives us.
With 15 minutes left in the session, both the S&P 500 and the NYSE are in Capitulation territory. Unless there’s a meaningful rally into the close, Capitulation is likely to be triggered at the close, as we only need two of the three indexes to close at or below their respective Capitulation thresholds.
These levels remain valid for the entire week starting on April 7, 2025.

If we get Capitulation at the close, the BTI Sell signal will be canceled, and hence, the Composite will remain 50% invested. If not, then the BTI SELL for today remains active.
This table summarizes the actions to follow:

Since the market appears to be hovering around the capitulation levels, I’ll send another email after the close with the final prices.
You know I only reach out when market conditions truly warrant it—I do my best to avoid cluttering your inbox with unnecessary emails. That said, we’re currently navigating exceptional circumstances, and staying closely connected feels more important than ever.
If it feels like I’m emailing more than usual, I appreciate your understanding. Rest assured, once the market returns to more normal conditions, I’ll go back to reaching out only when action is needed.
Email sent on 4/7/2025
Email Title: Capitulation was triggered on 4/7/25. Important updates. Trades to execute.
Note: All references to days and prices refer to trading days and closing prices.
Another dense update today. I do my best to keep things digestible, but we’re navigating a market environment reminiscent of March 2020—marked by extreme volatility and multiple signals triggering simultaneously. The silver lining? Situations like this are rare.
Executive summary:
- Capitulation was triggered on 4/7/25 at the close.
- Capitulation keeps the Composite at 50% invested. So, no action.
- For those trading the DT21C strategy independently, the DT21C goes back to 50% invested.
- For those trading the BTI strategy independently, the BTI goes down to 50% invested.
- The DT21C+HRS goes back to 50% invested. See details of the new ETFs below.
Capitulation triggered on 4/7/25 at the close.
Please refer to my emails dated April 4, 2025, and April 7, 2025 (also available on the Subscribers’ Portal) for more details regarding this Capitulation. Capitulation affects all our Timing Indicators, as you’ll see below.
This Special Report explains that our Capitulation Indicator tends to trigger near important bottoms and provides you with a wealth of statistical data. While we don’t know what the future holds, we are aware that the probability of a significant market rebound is now high.
Dow Theory for the 21st Century (DT21C)
The DT21C was in RED (SELL) since 3/4/25. Capitulation means that the DT21C goes back from 0% to 50% invested (YELLOW). Therefore, those using the DT21C as their real-money portfolio should revert to a 50% invested position (Rule #1, last line of the Special Report). The ETFs I use are DIA, SPY, RSP, and QQQ. VOO is an alternative to SPY.
Blay Timing Indicator (BTI)
The BTI SELL on 4/7/25 was partially neutralized by Capitulation. Hence, as with the DT21C, those using the BTI as their real-money portfolio should sell ½ of their holdings and go to a 50% invested position. The BTI is now in YELLOW.
As a reminder, as of this writing, market health (MH), one of the components of the BTI, stands at zero, indicating poor market health. However, if MH improved slightly, and given that the trend of margin is still positive, the BTI could trigger a new Buy signal soon.
More about the BTI HERE.
I will keep you informed, of course.
The Composite Indicator
This indicator, which we use for our real-money portfolio, is in yellow (50% invested) following the DT21C 3/4/25 Sell signal, the BTI 4/7/25 SELL, and the 4/7/25 Capitulation.
The logic of its current status is as follows:
- DT21C SELL on 3/4/25: Go to 50% invested
- BTI SELL on 4/7/25: Go to 0% invested BUT
- Capitulation on 4/7/25 brings the Composite to 50% invested.
Since the BTI SELL and Capitulation signals occurred on the same day, the net result is to do nothing and maintain the Composite at 50% invested.
The first two paragraphs of the Special Report give you a more in-depth explanation:

DT21C+Relative Strength Strategy:
The DT21C+RS strategy is in cash or short-term interest-bearing instruments, following the 3/4/25 DT21C Sell signal. Capitulation brings the DT21C+HRS back to 50% invested.
The lookback period I used is from December 6, 2024, to April 7, 2025. You can find an in-depth explanation, including charts, on how to calculate the lookback period in the event of capitulation in the last paragraph of page 5 of the Special Report.
The following ETFs should be bought, preferably at the open on April 8th, 2025.
Sector Strategy:
Below is the most recent ranking:
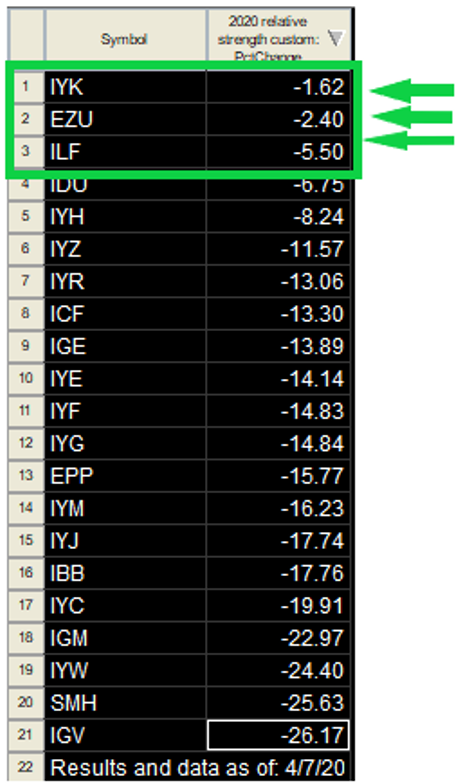
25% of the equity allocated to this strategy will be invested at the market open on April 8, 2025, with equal allocations to IYK, EZU, and ILF (so, 25%/3 for each ETF).
Style Strategy:
Below is the most recent ranking:
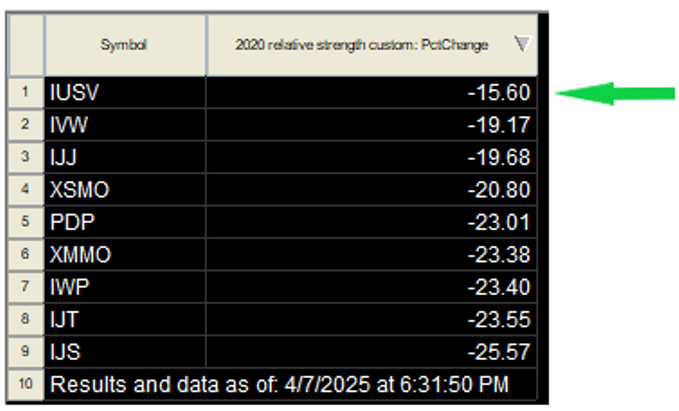
25% of the equity allocated to this strategy will be invested at the market open on April 8, 2025, to IUSV.
Therefore, the total equity to be invested in the Sector and Style strategies tomorrow will be 50% of the equity allocated to this strategy (i.e., 25% + 25% = 50%).
The remaining 50% will be held in cash and will be deployed as price action unfolds.
We will, of course, keep you updated.
Bear Market Definition
The price levels that must be jointly met for our Bear Market Definition (BMD) to trigger are:

So, the Dow Industrials is still above the BMD level. Please mind the word “jointly”: both the S&P 500 and the Dow Industrials must be below the prices shown in the table above.
As I mentioned in my April 4, 2025 email, a Bear Definition following Capitulation does not impact our trades—Capitulation takes precedence. Therefore, even if the Bear Definition is triggered soon, it will not alter our current trading decisions.
Email sent on 4/15/2025
Email title: Mid-Month Update
![]()
Note: All references to days and prices refer to trading days and closing prices.
No signals to act on for stocks – just a market update.
Executive Summary:
- The Composite is YELLOW (50% invested).
- The Dow Theory for the 21st Century (DT21C) is YELLOW (50% invested).
- The Blay Timing Indicator (BTI) is YELLOW (50% invested).
- Margin Debt dropped by -4.12%, and its trend shifted to bearish.
- No changes in our DT21C+High Relative Strength ETFs portfolio.
Timing Indicators:
First off, let’s get started with our Timing Indicators.
The Composite Indicator:
This is the indicator we use for our real-money portfolio, which remains YELLOW (50% invested). There have been no changes to its two components—the BTI and the DT21C—both of which also remain in YELLOW. More about the Composite HERE.
Action: None required at this time.
Dow Theory for the 21st Century (DT21C)
There are no changes since our 4/7/25 email. The DT21C is in YELLOW (50% invested, for those who act on it) due to Capitulation which brought it to 50% invested. More about the DT21C HERE.
Now, we are looking forward to a 5-day bounce confirmed by the S&P500 (SPX) and one of either the Dow Industrials (DJIA) or the Dow Transports (DJT). The bounce must be at least 3% on the S&P500 index and one of the other two indexes (Rule #1 of the Special Report). Such a bounce would be completed once the S&P500 surpasses its 4/9/25 closing highs at 5,456.90 and either the Dow Industrials or Transportation better their respective 4/9/25 closing highs at 40,608.45 and 13,913.01, respectively.
After that bounce, which has yet to materialize, we look for a >=3% pullback on the S&P500 and either the Dow Industrials or Transportation that lasts at least 2 trading days. This would complete the setup for a potential Buy signal (Rule #3 of the Special Report).
Don’t worry if it sounds complicated. We are living in a complex market situation not seen since March 2020, and I am here to discern and apply our rules.
The key takeaway now is that nothing is to be done.
I will keep you punctually informed as price action unfolds and action is needed.
The Blay Timing Indicator (BTI):
As I explained in the 4/7/25 email, the BTI is in YELLOW (50% invested, for those who invest in it) due to a simultaneous Sell signal and Capitulation on 4/7/25. More details in our 4/7/25 email.
Margin debt (MD) for March, released on 4/15/25, dropped by 4.1%, shifting the MD trend to bearish.
Another BTI component, market health (MH)—which reflects the ratio between “aggressive” and “defensive” indexes—has dropped to 0 (on a scale from 0 to 3). This represents poor market health.
The combination of a negative MD trend and a 0 MH reading makes a Buy signal highly unlikely at this time. I continue to monitor the BTI daily and will inform you immediately if a BUY signal is triggered.
So, no action.
More about the BTI HERE.
DT21C+Relative Strength Strategy:
No changes here. The DT21C+RS strategy moved to 50% invested following the Capitulation signal at the open on 4/8/25.
The 4/7/25 email outlines details regarding the specific ETFs and their weightings, which you can also find in the Subscribers Portal.
Once the DT21C issues a BUY signal, we’ll increase our allocation. Until then, we remain on standby, and I’ll update you promptly when action is required.
So, no action.
Closing Thoughts for the Stock Market:
Our Bear market definition (explained here and here) was met on 4/8/25 when the S&P500 and the Dow Industrials each closed more than -16 % below their respective highs (S&P 500: 6,144.15 on 2/19/25; Dow: 45,014.04 on 12/4/24).
Typically, the further decline following a Bear market being triggered entails an average further loss of -12.59 % until the final bear market bottom. However, when Capitulation and a Bear market are signaled close to each other (either on the same day or with one day’s distance), as happened last week, Capitulation tends to prevail, and the Bear market tends to be muted.
Since 1962, there have only been four such overlaps: 1990, 1998, 2011, and 2020.
In three out of four cases (1990, 1998, 2011), Capitulation halted the Bear market, resulting in only modest further declines. The exception was March 2020, where the market fell another –18.54% after the Bear definition.
The table below gives you the full data:
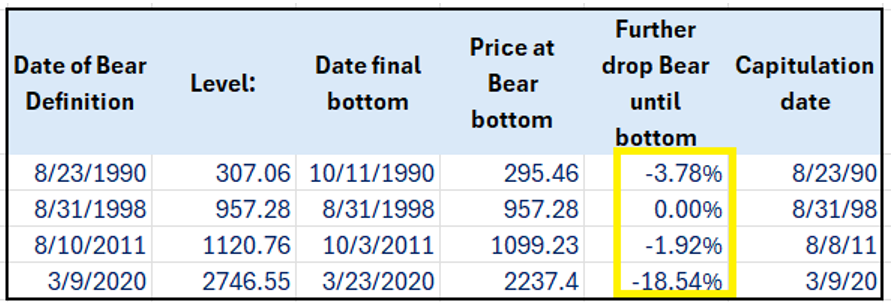
Will 2025 mirror 2020, or will Capitulation again prove to be a “Bear killer”?
We cannot know for sure. What we do know is that Capitulation signals have historically been reliable markers of Bear market lows and that in three of the four overlapping cases, Capitulation reversed the Bear.
🎙️ Two Powerful Conversations on Market Trends and Crypto Clarity
I recently enjoyed joining Maurizio Pedrazzoli on his YouTube channel for a compelling deep dive into Bitcoin and Ethereum. We analyzed both daily and weekly charts, identifying critical support levels that must hold—and why, like it or not, Ethereum is essential to truly understand Bitcoin’s trend and avoid false signals.
👉 Watch here:
In another timely conversation, I joined Andrew Horowitz for the latest episode of The Disciplined Investor podcast. We unpacked the recent market rollercoaster, marked by self-inflicted uncertainty and sharp swings. I shared key  insights based on Dow Theory, the S&P 500’s recent decline, and what defines a valid rally. We also discussed capitulation, today’s economic challenges, and how our timing indicators are navigating this volatile environment.
🎧Listen here:
thedisciplinedinvestor.com/blog/2025/04/13/tdi-podcast-urgent-market-signals-916
If you’re serious about market analysis—whether stocks or crypto—these two interviews are worth your time. They also offer new subscribers a valuable glimpse into our edge to time the markets.
Crypto (Bitcoin):
The primary and secondary trend is bearish since Bitcoin and Ethereum jointly pierced their 3/10/25 lows, reconfirming the bear market.
A new bull market will be signaled only if both BTC and ETHE break above their 3/24/25 highs—88,782.7 for BTC and 2,102.08 for ETHE.
The above-linked interview concerning Bitcoin can give you additional insights.
U.S. Bonds (TLT & IEF):
The primary and secondary trend was signaled as bullish (yes: no typo) on 4/4/25. You may read the full explanation with charts and table here.
Gold (GLD) and Silver (SLV):
There are no changes from our April 1st Letter. The primary trend is bullish; the secondary one is bearish.
Gold and Silver miners’ ETFs (GDX & SIL):
The trend shifted to bullish on 3/13/25. This 3/14/25 post gives you the details. GDX and SIL make higher highs on 4/14 and 4/15/24, which confirms the primary and secondary trend as bullish.
See you in our May 1st Letter, or even earlier, should market developments dictate.

